Buckling
Buckling of columns : When a slender structural member is loaded with an increasing axial compression force, the member deflects laterally and fails by combined bending and compression rather than by direct compression alone. This phenomenon is called buckling.
Critical load of a structure is the load which creates the borderline between stable and unstable equilibrium of the structure or is the load that causes buckling of the structure.
Lateral torsional buckling of beams : Lateral torsional buckling is a phenomenon that occurs in beams which are subjected to vertical loading but suddenly deflect and fail in the lateral and rotational directions
- The buckling load of a column is proportional to the flexural rigidity of the cross-section EI and the inverse of the column length squared
 . Increasing the value of the second moment of area of the section I and/or reducing the length L will increase the critical load.
Model Demonstrations
Buckling shapes of plastic columns
These models demonstrate the phenomenon of buckling and the buckling shapes of a column with different boundary conditions. Users can feel the magnitudes of the buckling forces of the plastic columns.

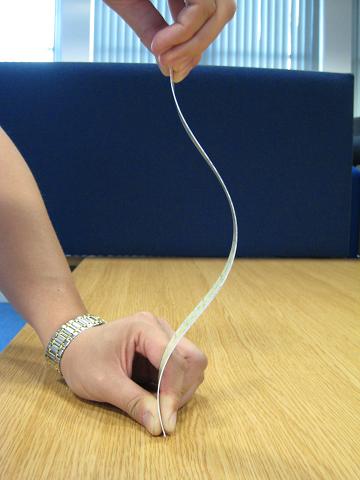
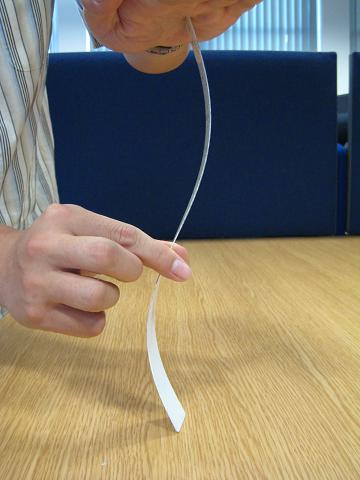
Fig. 10-5: Buckling shapes and boundary conditions of a plastic ruler
Column buckling behaviour can be demonstrated using slender members such as a thin plastic ruler.
- Put one end of the ruler on the surface of a table and the other end in the palm of one’s hand. Press axially on the top end of the ruler and gradually increase the compression force. The straight ruler will suddenly deflect laterally as shown in Fig. 10-5a. The deformation becomes larger with further application of the compressive force. This simulates the buckling of a column with two pinned ends.
- Now hold the two ends of the ruler tightly to prevent any rotational and lateral movements of the two ends of the ruler. Then gradually press axially on the ruler using the fingers until the ruler deforms sideways as shown in Fig. 10-5b. This demonstrates a different buckling shape for a column with two ends fixed. One can clearly feel that a larger force is needed in this demonstration than in the previous demonstration.
- If one intermediate lateral support is provided, so that the ruler cannot move sideways at this point, a larger compressive force will be required to make the ruler buckle in the shape shown in Fig. 10-5c.
Buckling loads and boundary conditions
This model demonstrates qualitatively and quantitatively the relationships between the critical loads and boundary conditions of a column (Eq. 10-3) and the corresponding buckling shapes.
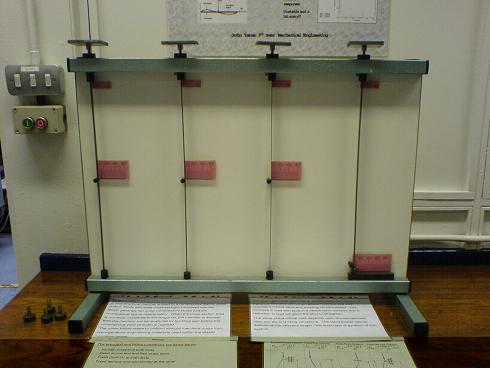
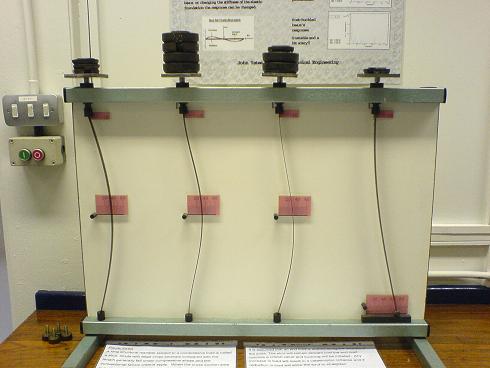
Fig. 10-6: Critical loads, buckling shapes and boundary conditions of columns
The model shown in Fig. 10-6 contains four columns with the same cross-section but each with different boundary conditions; (from left to right and from bottom to top), pinned-pinned, fixed-fixed, pinned-fixed and free-fixed. The model has load platens on the tops of the columns which allow weights to be added and applied to the columns. This model can demonstrate the different buckling or critical loads of the columns and the associated buckling shapes or modes.
- The different boundary conditions should be observed by the user before applying loads to the columns. (Fig. 10-6a)
- Weights are added incrementally to the platens until the columns buckle (Fig. 10-6b) at which time the loads, including the weights and the platens, are the critical loads of the columns and the shapes of the columns are the buckling modes.
- With all columns loaded (Figure 10.6b), the relative buckling loads and buckling modes can be observed and compared for the different boundary conditions. Table 10-2 gives the measured critical loads of the four columns.
Table 10-2: Comparison of buckling loads of a column with different boundary conditions
| Boundary conditions | Pinned-Pinned | Fixed-fixed | Fixed-pinned | Fixed-free |
| Critical load | ||||
| Relative critical load | 1 | 4 | 2.05 | 0.25 |
| Test critical load ( N ) | 5.61 | 20.8 | 13.0 | 4.05 |
| Relative test critical load | 1 | 3.71 | 2.31 | 0.72 |
It is to be expected that there will be some differences between the predicted and the test critical loads, but significant error occurs in the fixed-free model (Table10-2). Several trials showed that the free-end at the bottom of the strut was not really free to move laterally due to small amount of friction. In addition, the column is shorter than the others, which can be seen in Fig. 10-6a. Real structures rarely behave in exactly the same manner as the theoretical models.
Lateral buckling of beams
This set of models demonstrates the behaviour of lateral buckling of a narrow rectangular beam with different sizes of section and thus the validity of Eq. 10-8.
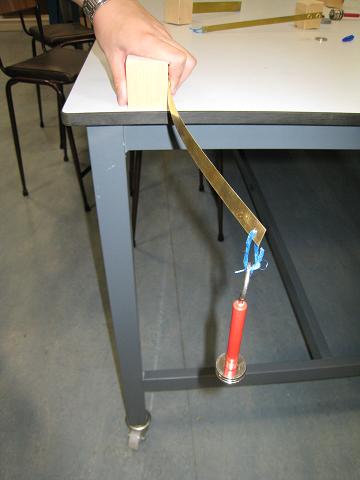
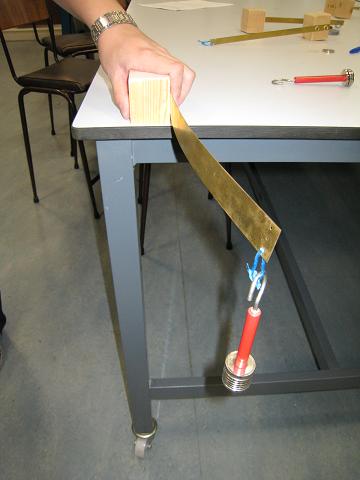
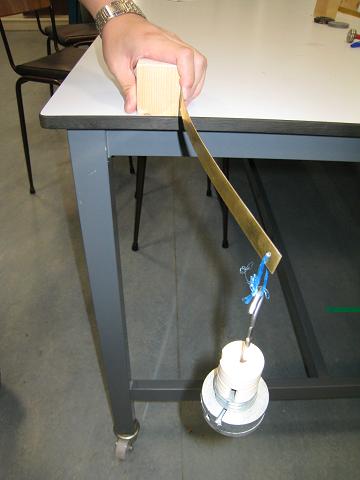
Fig. 10-7: Lateral torsional buckling behaviour
The buckling behaviour of the three brass cantilevers described in Example 10-1 is demonstrated through simple tests. One end of each of the brass strips is fixed to a wooden block through screws, creating cantilevers as shown in Fig. 10-7.
Model A: 270 mm long cantilever with a 12.7 mm x 0.397 mm rectangular cross-section
Hold one end of the cantilever (Fig. 10-7a) firmly and apply a vertical concentrated load at the free end. Increase the load gradually until the beam moves sideways and twists (when the loading is about 0.49N). This type of deformation typifies the form of instability called lateral torsional buckling.
Model B: 270 mm long cantilever with a 25.4 mm x 0.397 mm rectangular cross-section
The effect of increasing the height of the section: repeat the type of test carried out for Model A. When the concentrated load reaches approximately 0.98N, the cantilever starts to move sideways and twist (Fig. 10-7b). This value is twice that of the critical load for Model A. As predicted by Eq. 10-8 doubling the height of the narrow beam doubles the buckling moment or the critical load.
Model C: 270 mm long cantilever with a 12.7 mm x 0.794 mm rectangular cross-section
The effect of increasing the width of the section: repeat the type of test carried out for Models A and B. When the concentrated load reaches approximately 3.82N, the cantilever starts to move sideways and twist (Fig. 10-7c). The load is now nearly eight times that which caused lateral torsional buckling of Model A. It is about four times that which caused lateral torsional buckling of Model B although the cantilever uses the same amount of material as Model B. Following Eq. 10-8, the buckling load of Model C should be exactly eight times that of Model A and four times that of Model B.
Model D: Model A with a lateral support
The effect of lateral restraint: repeat the type of test carried out for Model A but this time hold the cantilever at mid-span using a finger and thumb to prevent lateral movement. The loading can increase significantly without lateral buckling. This indicates that the lateral restraint effectively increases the lateral torsional buckling capacity of the cantilever.
Table 10-3: Comparison between the calculated and measured lateral buckling loads
| Boundary conditions | Model A | Model B | Model C |
| Theoretical critical load ( N ) | 0.462 | 0.924 | 3.70 |
| Relative theorectical critical load | 1 | 2 | 8 |
| Test critical load ( N ) | 0.49 | 0.98 | 3.83 |
| Relative test critical load | 1 | 2 | 7.8 |
Buckling of an empty aluminum can
This demonstration shows that local buckling occurred on a drinks can causes the global collapse of the can.
Fig. 10-8: Buckling failure of empty drinks cans
The phenomenon of buckling is not limited to columns. Buckling can occur in many kinds of structures and can take many forms. Fig. 10-8a shows that two empty drinks cans can carry a standing person of 65 kg. However, this is close to the critical loads of the two cans. When the standing person slightly moved his body, which caused a small shift of some of the body weight from one can to the other, the thin cylindrical wall of one can buckled and the cans then collapsed completely as shown in Fig. 10-8b.
Practical Examples
Buckling of bracing members
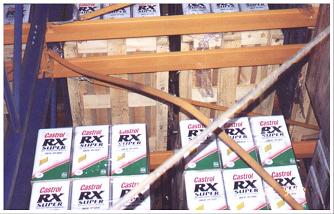
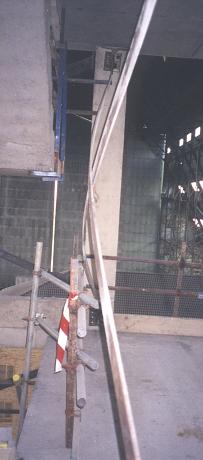
Fig. 10-9: Buckling of bracing members
Steel bracing members are normally slender and are not ideal for use in compression. Therefore they are usually designed to transmit tension forces only. For cross-braced panels which are often used to resist lateral loads, one bracing member will be in tension and the other in compression. When the loading is applied in the opposite direction, the member previously in tension will be subjected to compression and the other member becomes a tension member.
Fig. 10-9a shows one of two bracing members in a panel of a storage rack which has buckled. Comparing the value of the material stored and cost of the bracing members, the use of more substantial bracing members would have easily been justified. Fig. 10-9b shows two buckled bracing members in a building.
Buckling of a box girder
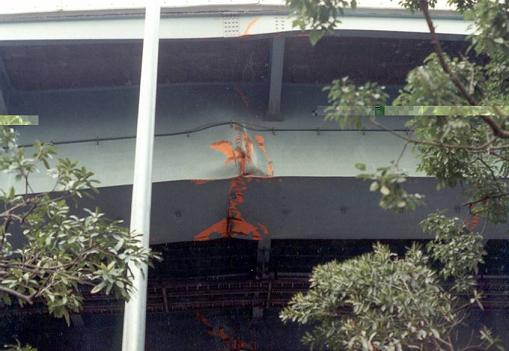
Fig. 10-10 shows a box girder that buckled during an earthquake. The girder was subjected to large compressive forces and the material was also squashed.
Prevention of lateral buckling of beams
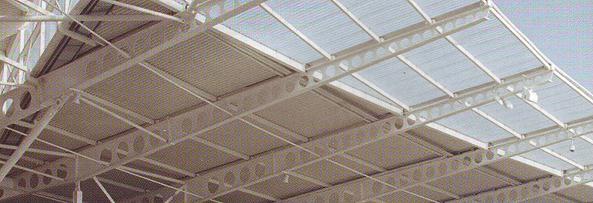
Fig. 10-11 shows a system where additional members are provided to prevent the lateral and torsional buckling of cantilever beams through reducing the beam length. Cellular beams are used as supporting structures for the cantilever roof of a grandstand. The lower parts of the beams are subjected to compressive forces, but the lateral supports from the roof cladding on the top of the beams may not be effective at preventing lateral and torsional buckling at the bottom parts of the beams, thus additional members are placed perpendicular to the beams.
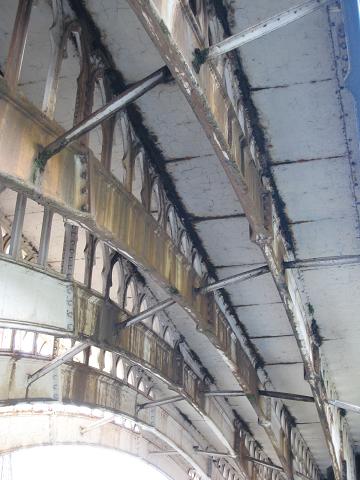
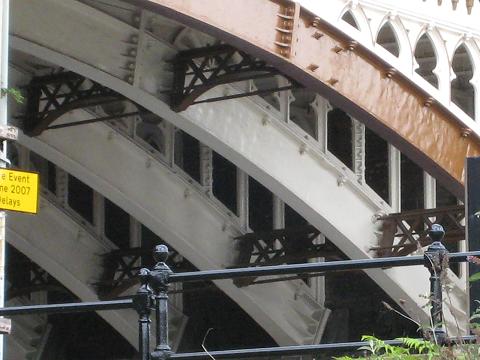
Fig. 10-12: Members are provided to prevent the lateral buckling of arches
Fig. 10-12 shows the lateral supports provided to two arch bridges. The loads on the bridges are transmitted through mainly the compression forces in arches to the supports of the arches. Thus lateral supports are provided to prevent any possible lateral buckling.
Example 4: Bistability of a slap band
Bistability is a fundamental phenomenon in nature. A slap band that is bistable can be at rest in two equilibrium states. By default, the band will be in the state with the minimum energy as shown on the right side in Figure 10.A1a. A transition from the state of minimal energy to the other state of equilibrium that has maximum energy requires some form of activation energy to be provided. If one stretches the band into a straight position, it can be held as shown in Figure 10.A1b. If a little disturbance is given to the straight band which corresponds to the state of maximum energy, the band will relax into the state of lowest energy again.

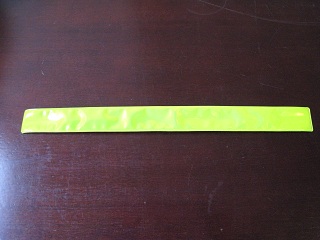
Figure 10.A1: A slap band at its two equilibrium states with the largest and smallest energies
Reflective slap bands, as shown in Figure 10.A1, have high visibility and became a safety product, which can be wrapped round wrists, arms and legs. Due to the interesting nature of bistability and low cost, slap bands are also used as a promotion product.
References
10.1 Benham, P P, Crawford, R J and Armstrong, C G, (1998), Mechanics of Engineering Materials, Addison Wesley Longman Limited, Harlow, ISBN 0-582-25164-8.
10.2 Kirby, P A and Nethercot, D A, (1979), Design for Structural Stability, Granada Publishing, London, ISBN 0258 97063 4.
10.3 Gere J M (2004), Mechanics of Materials, Sixth Edition, Thomson Books/Cole, USA, ISBN 0-534-41793-0.
10.4 Allen H G and Bulson P S, (1980), Background of Buckling, McGraw-Hill, New York, ISBN 0-07-084100-4.
10.5 Timoshenko S P and Gere J M, (1961), Theory of Elastic Stability, McGraw-Hill, New York, ISBN 0-07-085821-7.