<—Dynamics: Energy Exchange—>
<—Definition and Concepts—>
Energy Exchange
Conservative systems: A system is said to be conservative if no energy is added or lost from the system during movement. This is an idealised system but one that can be used to aid the solution of many problems. In real structures internal friction forces will do work and damping will dissipate energy.
Conservation of energy means that the total energy at two different positions or at two different times is the same in a conservative system.
Conservation of momentum indicates that the momentum of a system is the same at two different times when the resulting external force is zero between those two times.
- Energy can be transformed from one form to another, for instance, mechanical energy can be changed into electrical energy.
- For a conservative system, the total energy is constant and a body once moved will continue to move or to vibrate. During motion there is a constant exchange between potential energy and kinetic energy.
- For a non-conservative system, energy has to be added continuously to maintain motion.
<—Model Demonstrations—>
<—Model 1—>
A Moving Wheel
This demonstration shows the energy exchange between several common forms of energy, including gravitational potential energy, kinetic energy, energy loss due to friction and electro-magnetic energy.
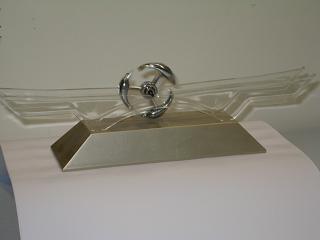
Fig. 13-2: A moving wheel showing energy transformation
Two parallel, parabolic plastic tracks supporting an aluminum wheel are shown in Fig. 13-2. Three small magnets are placed on the perimeter of the aluminum wheel. Four batteries are located in the track support and an electro-magnetic field is also provided in the base support.
Place the wheel at one end of the tracks and release it. The wheel rolls towards the middle of the tracks with increasing speed as the potential energy of the wheel changes to kinetic energy. When passing the middle part of the tracks, the wheel speeds up due to a charge of electro-magnetic energy which is sufficient to compensate for the energy loss due to the friction between the wheel and the tracks. The wheel then moves upwards and the kinetic energy is converted to potential energy. When all the kinetic energy is converted, the wheel stops and then starts to roll back down the track for a new cycle of movement. The wheel will continue to roll backwards and forwards along the track as long as sufficient electro-magnetic energy is provided to compensate for the energy loss due to friction.
<—Model 2—>
Collision Balls
This demonstration shows the use of the principles of conservation of energy and conservation of momentum.
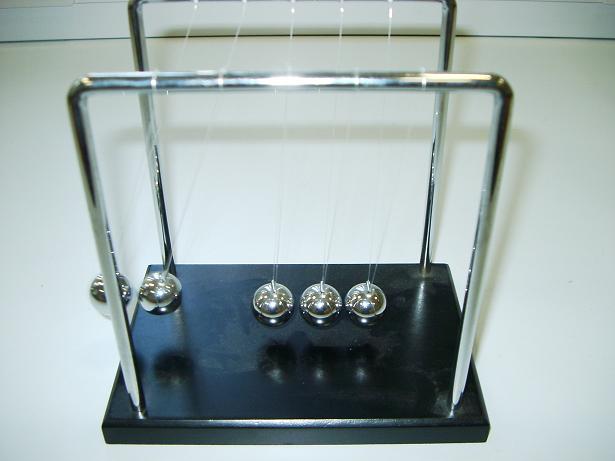
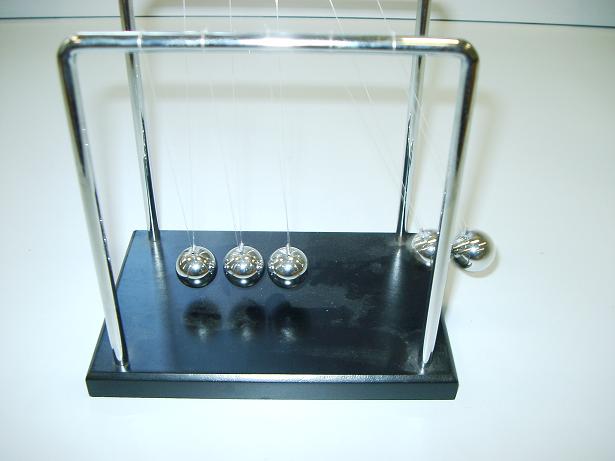
Fig. 13-3: Collision balls
Fig 13-3 shows a Newton’s cradle which consists of five identical stainless steel balls suspended from the above and arranged in a row with each ball just touching its neighbour(s). When one pulls a ball back and releases it, it collides with the row of the remaining balls, ejecting one at the far end. If one pulls two balls and releases them, they eject two balls at the far end as shown in Fig. 13-3. Lifting and releasing three balls ejects three balls at the far end, and pulling four ejects four.
First consider the collision between two identical balls of mass m , one moves with initial velocity ![]() and the other is at rest with
and the other is at rest with ![]() . After the collision, the two balls move with velocities
. After the collision, the two balls move with velocities ![]() and
and ![]() respectively. Conservation of momentum requires:
respectively. Conservation of momentum requires:
![]() or
or ![]()
Conservation of energy requires:
![]() or
or ![]()
Squaring the first equation and subtracting the second equation leads to:
![]() or
or ![]()
As ![]() ,
, ![]() . This shows that after collision the first ball will be at rest [13.5, 13.6].
. This shows that after collision the first ball will be at rest [13.5, 13.6].
Now consider the case of several balls. Let ![]() be the total mass of the balls launched with velocity
be the total mass of the balls launched with velocity ![]() and
and ![]() be the total mass of the balls ejected with velocity
be the total mass of the balls ejected with velocity ![]() . Noting that after collision,
. Noting that after collision, ![]() becomes stationary, i.e.
becomes stationary, i.e. ![]() and using conservation of momentum and conservation of energy gives:
and using conservation of momentum and conservation of energy gives:

Squaring the first equation and subtracting ![]() times the second equation gives:
times the second equation gives:

This equation shows that the number of balls ejected is equal to the number of balls launched if all the steel balls are the same size, as shown in Fig.13-3.
<—Model 3—>
Dropping a Series of Balls
This model gives an entertaining demonstration of conservation of energy.
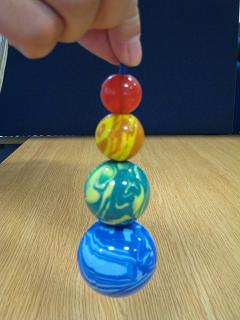
Fig. 13-4: Dropping a series of balls
Fig. 13-4 shows four rubber balls of different sizes placed together using a plastic bar passing through their centres with the smaller balls resting on the larger balls.
When the balls are lifted vertically for a distance of about 0.15 m from a desk and then released, the smallest ball rebounds to hit the ceiling which is over two metres above the desk. This observation can be explained using either the principle of conservation of energy or the princile of conservation of momentum.
The total mass of the four balls is 120 grams and the mass of the smallest ball is 5 grams. The gravitation potential energy of the balls before dropping them is estimated to be:

After the impact of the largest ball on the desk, the three larger balls bounce up almost together about 0.03m. According to the conservation of energy, the total gravitational potential energy before and after impact should be the same if no energy loss takes place, i.e.

From the above equation, the predicted bounce height of the smallest ball is 2.92m. Actually there is some loss of energy due to the impacts between the largest ball and the desk and between the adjacent balls, so the smallest ball would not bounce quite as high as 2.92 m.
This example can also be analysed using the principle of conservation of momentum.
<—Practical Examples—>
<—Example 1—>
Roller Coasters
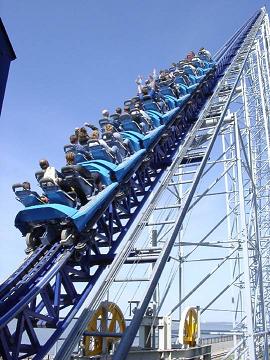
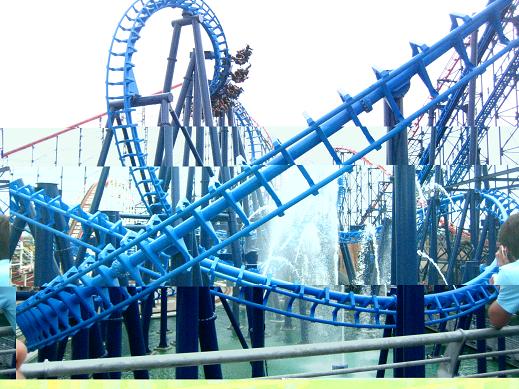
Fig. 13-5: Roller Coasters
Fig. 13-5a shows a roller coaster which is raised from ground level to the top of the first tower using mechanical energy. This builds up a reservoir of potential energy in the coaster.
When the coaster is released at the top of the tower, it moves forward and down, the potential energy being quickly converting to kinetic energy and the speed of the coaster increasing accordingly. The speed reaches its maximum when the coaster reaches the lowest point between two adjacent towers. The coaster then moves up to the next tower, the kinetic energy changing back to potential energy, and the speed of the coaster reduces as its potential energy increases. The rest of the towers, dips, twists and turns of the ride, serve to change the energy of the coaster back and forth between potential energy and kinetic energy (Fig. 13-5b).
During the motion, some energy will be lost due to friction and, for this reason, the first tower must be higher than all the other towers so that sufficient energy is provided to overcome the energy loss.
<—Example 2—>
A Torch Without a Battery
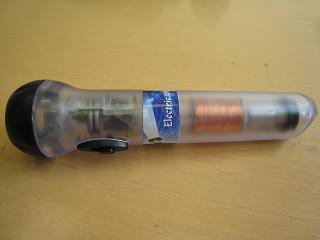
Fig. 13-6: An environmentally friendly torch
Torches are normally powered by batteries. However, Fig. 13-6 shows an environmentally friendly torch which works on the principle of energy exchange.
When one shakes the torch, the strong magnet at the far right in the body of the torch (Fig. 13-6) moves and passes through electrical wires backwards and forwards and produces an electric current. Part of the kinetic energy generated by the magnet is converted to electric energy. The electric energy then changes into chemical energy through the electronic circuit and is stored in an internal storage cell. When a user switches on the torch, the chemical energy in the storage cell converts to electric energy and the electric energy changes to light energy in the bulb.
<—References—>
References
13.1 Meriam, J L and Kraige, L G, (1998), Engineering Mechanics: Dynamics, Fourth Edition, John Wiley & Sons, New York, ISBN 0 471 24167 9
13.2 Beards, C F, (1996), Structural Vibration: Analysis and Damping, Arnold, London, IBSN 0 340 64580 6
13.3 Thomson, W T, (1988), Theory of Vibration with Applications, Allan and Unwin, London, ISBN 0 045 31003 3
13.4 Wang, G, (1981), Applied Analytical Dynamics, High Education Press, Beijing, China (in Chinese)
13.5 Sprott, J C, (2006), Physics Demonstrations: A Sourcebook for Teachers of Physics, The University of Wisconsin Press, Wisconsin, ISBN 0 299 21580 6.
13.6 Ehrlich, R, (1990), Turning the World Inside Out and 174 Other Simple Physics Demonstrations, Princeton University Press, Princeton, ISBN 0 691 02395 6.
<—Dynamics: Pendulum Systems—>
<—Definitions and Concepts—>
Pendulum Systems
A simple gravity pendulum consists of a massless string with one end attached to a weight and the other end fixed. When an initial push is given, the pendulum will swing back and forth under the influence of gravity.
A rotational suspended system: a rigid body is suspended by two massless strings/hangers of equal length, fixed at the same point and the body rotates about the fixed point in the plane of the strings.
A translational suspended system: a rigid body is suspended by two parallel and vertical massless strings/hangers with equal length and the strings rotate about their own fixed points. Thus the rigid body moves in parallel to its static position in the plane of the strings.
- The natural frequency of a simple pendulum is independent of its mass and only relates to the length of the massless string.
- The natural frequency of a translational suspended system is independent of its mass and the location of its centre of mass and is the same as that of an equivalent simple pendulum.
- The natural frequency of a rotational suspended system is dependent on the location of its centre of mass but is independent of the magnitude of its mass.
- An outward inclinely suspended system is a mechanism. When it is loaded vertically and asymmetrically, it will move sideway and rotate.
- The lateral natural frequency of a suspended bridge estimated using simple beam theory will be smaller than the true lateral natural frequency.
<—Model Demonstrations—>
<—Model 1—>
Natural Frequency of Suspended Systems
This model demonstration verifies Eq. 14-8 and shows the unstable equilibrium state at which the suspended system will not oscillate.


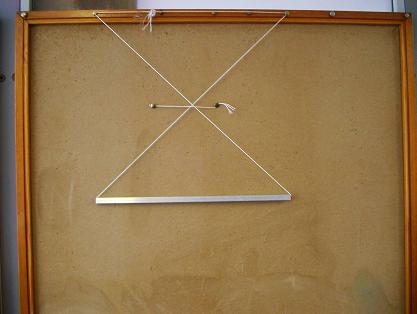
Fig. 14-4: Typical forms of a suspension system used for demonstration and tests.
A suspended system consists of a uniform hollow aluminium bar with a square section (a rigid body) and two symmetric strings to suspend the bar. The bar has a length of b =0.45m, total mass of M = 0.094 kg and moment of inertia about its centroid of ![]() . The length and the angles of the strings can be varied.
. The length and the angles of the strings can be varied.
Three typical suspension forms include vertical (Fig. 14-4a, ![]() ), outward inclined (Fig. 14-4b,
), outward inclined (Fig. 14-4b, ![]() ) and inward inclined (Fig. 14-4c,
) and inward inclined (Fig. 14-4c, ![]() ) suspension systems. In the tests, an initial lateral displacement is applied to the bar and the bar is suddenly released to generate free vibrations. The number of oscillations is counted and a stopwatch is used to record the duration of the vibrations. The swaying natural frequencies of seven different forms of suspension were measured and are listed in Table 14-2 together with the theoretical predictions obtained using Eq. 14-8. It can be seen that there is good agreement between the measured and calculated lateral natural frequencies.
) suspension systems. In the tests, an initial lateral displacement is applied to the bar and the bar is suddenly released to generate free vibrations. The number of oscillations is counted and a stopwatch is used to record the duration of the vibrations. The swaying natural frequencies of seven different forms of suspension were measured and are listed in Table 14-2 together with the theoretical predictions obtained using Eq. 14-8. It can be seen that there is good agreement between the measured and calculated lateral natural frequencies.
Figure 14-4d shows an unstable equilibrium state of the system where the two strings cross each other. An additional horizontal string is applied to prevent out-plane movement of the system. When a small movement is applied to the system, the aluminium bar moves to, and balances at, a new position without oscillation.
Table 14-2: Comparison of the measured and predicted lateral natural frequencies
| Parameters | Experiment | Theory | error |
| q =0 o , l =0.415m | 0.778Hz | 0.774Hz | -0.5% |
| q =-10.15 o , l =0.431m | 0.773Hz | 0.769Hz | -0.5% |
| q =-22.28 o , l =0.825m | 0.543Hz | 0.536Hz | -1.3% |
| q =-30.69 o , l =0.485m | 0.718Hz | 0.717Hz | -0.1% |
| q =-52.7 o , l =0.584m | UES | UES | – |
| q =24.66 o , l =0.405m | 0.930Hz | 0.929Hz | -0.1% |
| q =48.4 o , l =0.324m | 1.67Hz | 1.71Hz | 2.4% |
<—Model 2—>
Effect of Added Masses
The models demonstrate that the natural frequency of a translational suspended system is independent of its mass and the location of the centre of the mas,s and is the same as that of an equivalent simple pendulum.
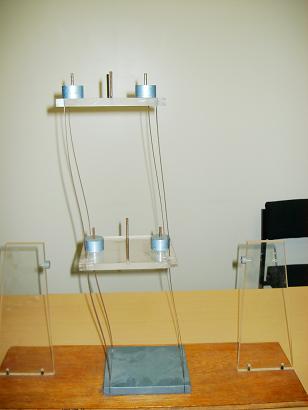
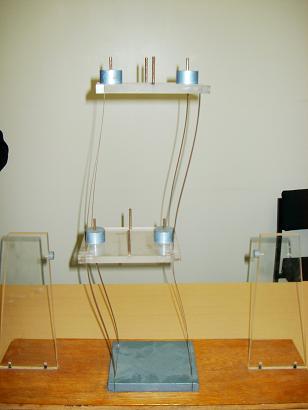
Fig. 14-5 shows another simple pendulum system. A plate is suspended by four strings through four holes at the corners of the plate. The other ends of the four strings are fixed to two cantilever frames as shown in Fig. 14-5. The strings are vertical when viewed from an angle perpendicular to the plane of the frame and are inclined when viewed in the plane of the frame.
When the plate moves in the plane of the steel frames, it forms a translational pendulum system in which the plate remains horizontal during its motion.
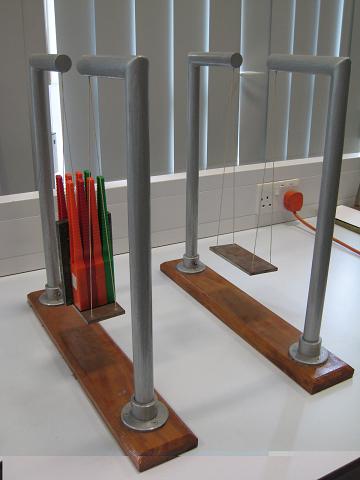
Fig. 14-6 shows two similar translational suspended systems in which the masses sway in the plane of the supporting frames. Eight magnetic bars and a steel block are placed on the plate of one suspended system to raise the centre of mass of the system. Applying the same displacement to the two plates in the planes of the frames and releasing them simultaneously, it can be observed that the two suspended systems with different masses and different centres of mass sway at the same frequency. This demonstrates that the natural frequency of a translational pendulum system is independent of its mass and the location of the centre of mass.
The suspended systems in Fig. 14-6 can also be used as two identical rotational suspended systems when the plates sway perpendicularly to the planes of the frames. Applying the same displacements to the two plates in the direction perpendicular to the frames and then releaseing them simultaneously, it can be observed that the plate with the added weights oscilates faster than the other plate.
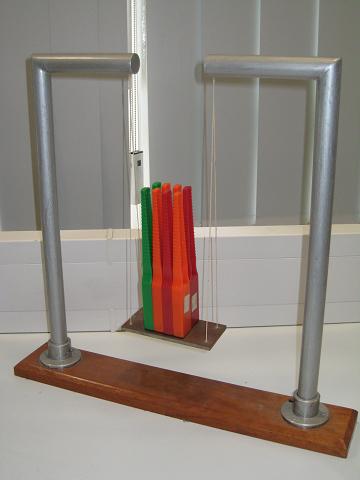
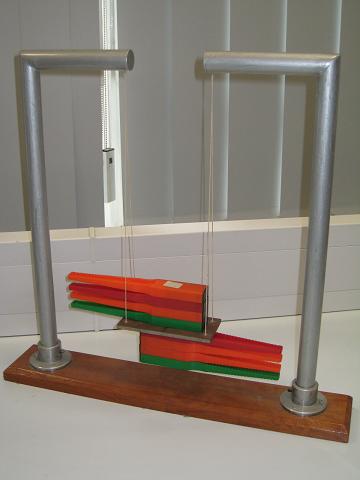
Fig. 14-7: Effect of the centre of mass
Fig. 14-7 show two arrangements of eight identical magnetic bars. In one case the eight bars stand on the plate (Fig. 14-7a) and in the other case four magnetic bars are placed on the top and bottom surfaces of the plate respectively (Fig. 14-7b). The two cases have the same amount of mass but different centres of mass. Conducting the same experiment as before for the rotational suspended systems, it can be seen that the system with standing bars oscillates faster than that with horizontal bars.
The systems shown in Figs. 14-5 and 14-7b have different amounts of mass but the same location of the centre of mass. If the oscillations of the two systems shown are generated by giving the same initial displacements in the plane perpendicular to the framnes, it can be observed that the two systems oscillate at the same frequency.
The two sets of experiments demonstrate that the natural frequency of a rotational suspended system is dependent on the location of its centre of mass but is independent of the magnitude of its mass.
Table 14-3 compares the times recorded for 30 oscillations of the translational and rotational suspended systems with added masses. Each case was tested twice.Table 14-3: Comparison of the times for 30 oscillations of the suspended systems
| Translational SuspendedSystems (seconds) | Rotational SuspendedSystems (seconds) | |
| Empty (Fig. 14-5) | 34.3, 34.4 | 34.4, 34.5 |
| With full weights (Fig. 14-6) | 34.3, 34.5 | 32.3, 32.4 |
| With magnetic bars placed vertically(Fig. 14-7a) | 34.2, 34.2 | 33.4, 33.3 |
| With magnetic bars placed horizontally(Fig. 14-7b) | 34.2, 34.3 | 34.3, 34.3 |
Effect of mass on the oscillation of a transverse suspended-system
Please wait 10 seconds for video autoplaying. Rightclick here to download this video piece. ***BROKEN LINK***
Effect of mass on the oscillation of a rotational suspended-system
Please wait 10 seconds for video autoplaying. Rightclick here to download this video piece. ***BROKEN LINK***
<—Model 3—>
Static Behaviour of an Outward Inclined Suspended System
This demonstration shows that an outward inclinely suspended system is a mechanism that moves sideway if a vertical load is applied asymmetrically on the plate.
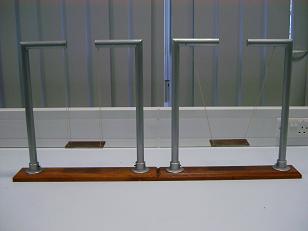
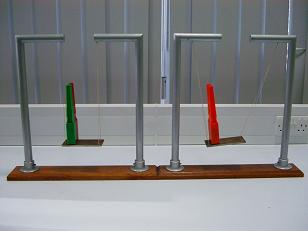
Fig. 14-8: Static behaviour of of an outward inclined suspended system.
Consider two suspended systems, where a steel plate is suspended by two vertical strings and the same plate is suspended by two symmetrically outward inclined strings, as shown in Fig. 14-8.
Place similar weights asymmetrically on the two plates as shown in Figure 14.8b. It can be observed that the vertically suspended system does not experience any lateral movement while the outward inclinely suspended system undergoes both lateral and rotational movements.
For the vertically suspended system, the vertical and lateral movements are independent and the vertical load only induces vertical deformations of the strings with little rotation due to the difference of the elastic elongation of the strings. For the plate suspended by the two outward inclined strings, the horizontal and rotational movements of the plate are coupled. The movements relate to the geometry of the system rather than the elastic elongation of the strings.
<—Practical Examples—>
<—Example 1—>
An Inclined Suspended Wooden Bridge in a Playground

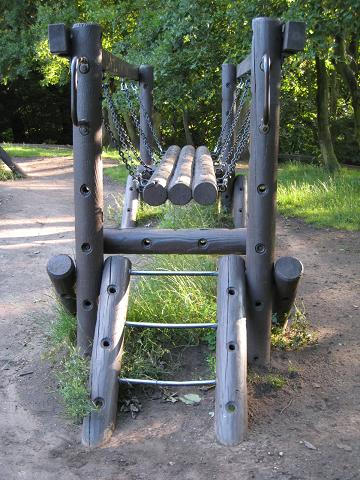
Fig. 14-9: An inclinly suspended wooden bridge in a playground
As demonstrated in Section 14.3.3, an inclined suspended system moves sideway if a vertical load is applied asymmetrically. The phenomenon should be avoided in engineering structures, as it may lead to unsafe structures. However, Fig. 14-9 shows an outward inclinely suspended wood footbridge in a playground. The bridge is purposely built in such a way so that the bridge wobbles when a child walks on the bridge, creating excitement and a challenge for crossing the bridge.
<—Example 2—>
Seismic Isolation of a Floor
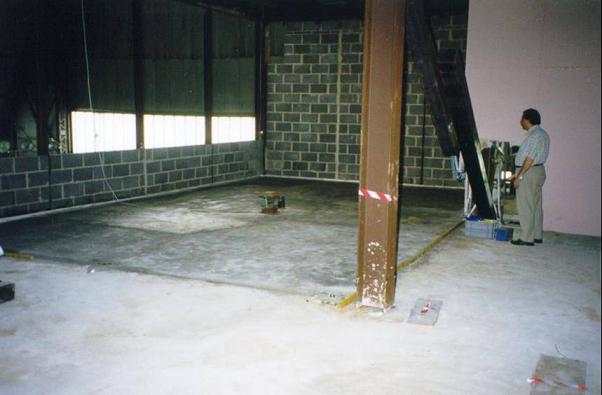
Fig. 14-10: A translational suspended floor (Courtsy of Porf. M Kawaguchi)
As the natural frequency of a translational suspended system is only governed by its length and is independent of its mass, the concept of a pendulum seismic isolator was developed and used in Japan.
As shown in Fig. 14-10, a floor suspended from girders of a building frame in the form of a translational suspended system was adopted for the exhibition rooms of an actual museum for pottery and porcelain in Japan. The area of the suspended floor is about 1000 , and its mass is about 1000 tonnes. Hinges having universal joints were used for the upper and lower ends of the hangers. The hangers were 4.5 m long, producing a natural period of more than 4 seconds, which was considered sufficiently long for seismic isolation.
<—Example 3—>
The Foucault Pendulum
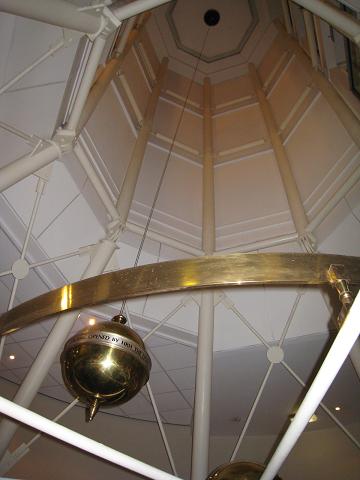
Fig. 14-11: The Foucault pendulum
Fig. 14-11 shows a huge brass pendulum that swings across the lower foyer in the Manchester Conference Centre at the University of Manchester. The pendulum was set up as a tribute to Jean Bernard Leon Foucault.
Jean Bernard Leon Foucault (1819 – 1868), a French physicist, demonstrated the earth’s rotation using his famous pendulum. He suspended a 28 kg bob with a 67 m wire from the dome of the Pantheon in Paris. Foucault was acclaimed by witnesses for proving that the earth does indeed spin on its axis. As the plane of the pendulum oscillation remained unchanged with the stars, they could understand that the Pantheon moved around the pendulum, and not vice-versa!
Foucault’s pendulum was the first dynamical proof of the earths rotation in an easy-to-see experiment.
<—References—>
References
14.1 Matthews, M R, Gauld C F and Stinner, A, (2005), The Pendulum: Scientific, Historical, Philosophical and Educational Perspectives, pp. 37-47, Springer Netherlands, Dordrecht, ISBN 978-1-4020 3525 8.
14.2 Zou, D and Ji, T, (2008), Dynamic characteristics of a generalised suspension system, International Journal of Mechanical Sciences, Vol. 50, pp. 30-42.
<—Dynamics: Free Vibration—>
<—Definition and Concepts—>
Free Vibration
Free vibration : A structure is said to undergo free vibration when it is disturbed from its static stable equilibrium position by an initial displacement and/or initial velocity and then allowed to vibrate without any external dynamic excitation.
Period of vibration: The time required for an undamped system to complete one cycle of free vibration is the natural period of vibration of the system.
Natural frequency : The number of cycles of free vibration of an undamped system in one second is termed the natural frequency of the system, and is the inverse of the period of vibration.
A SDOF system : If the displacement of a system can be uniquely determined by a single variable, this system is called a single-degree-of-freedom (SDOF) system. Normally it consists of a mass, a spring and a damper. The square of the natural frequency of a SDOF system is proportional to the stiffness of the system and the inverse of its mass.
A generalised SDOF system : Consider a discrete system that consists of several masses, springs and dampers, or a continuous system that has distributed mass and flexibility. If the shape or pattern of its displacements is known or assumed, the displacements of the system can then uniquely be determined by its magnitude (a single variable). This system is termed as a generalised SDOF system. The analysis developed for a SDOF system is applicable to a generalised SDOF system.
- For a structure with a given mass, the stiffer the structure, the higher the natural frequency.
- The larger the damping ratio of a structure, the quicker the decay of its free vibration.
- The higher the natural frequency of a structure, the quicker the decay of its free vibration.
- The fundamental natural frequency reflects the stiffness of a structure. Thus it can be used to predict the displacement of a simple structure. Also the displacement of the structure can be used to estimate its fundamental natural frequency.
<—Model Demonstrations—>
<—Model 1—>
Free vibration of a pendulum system
This demonstration shows the definitions of natural frequency and period of a simple system.
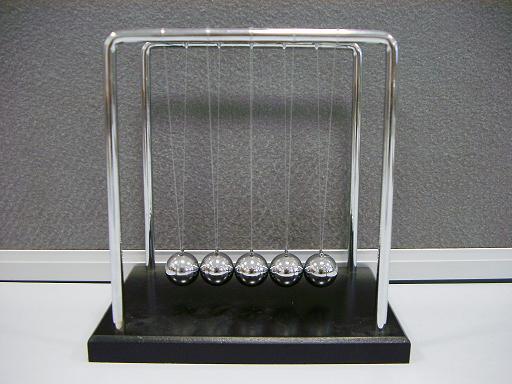
Fig. 15-8 shows a pendulum system consisting of five balls suspended by strings with equal length (known as Newton’s cradle). Push the balls in a direction parallel to the plane of the frames to apply an initial displacement and release the balls. The balls then move from side to side in free vibration at the natural frequency of the system.
Count the number of oscillations of the balls in 30 seconds and the number of oscillations divided by 30 is the natural frequency of the oscillations of the pendulum system in cycles per second or Hz. The inverse of the natural frequency is the period of the oscillations. For the studied system, 40 cycles of oscillation in 30 seconds were counted. Thus the natural frequency of the system is 40/30 = 1.33 Hz and the period is 1/1.33 = 0.75s.
The vertical distance between the supports of the strings and the connecting points on the balls is 140mm so the theoretical value of the natural frequency is:
![]()
<—Model 2—>
Vibration decay and natural frequency
This set of models demonstrates that the higher the natural frequency of a structure, the quicker the decay of its free vibration.
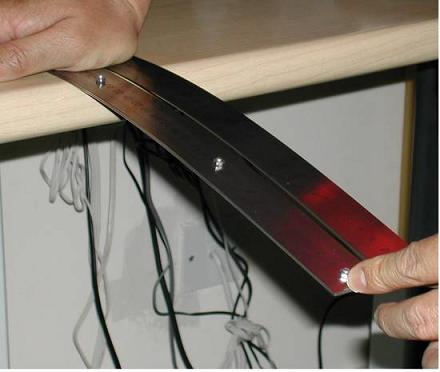

Fig. 15-9: The decay of free vibration and the natural frequencies of members
A single steel ruler and a pair of identical steel rulers, bolted firmly together, are placed side by side as cantilevers shown as in Fig. 15-9a. Give the ends of the two cantilevers the same initial displacement and release them suddenly at the same time (Fig. 15-9a). Free vibrations of the rulers follow and it will be observed that the bolted double ruler stops vibrating much more rapidly than the single ruler (Fig. 15-9b).The rate of decay of free vibration is proportional to the product of the damping ratio and the natural frequency of the structure as shown in Eq. 15-15 and Example 15-1. The bolted double ruler has a higher natural frequency since its second moment of area is 8 times of that of the single ruler, making it 8 times as stiff as the single ruler, while its mass is just double of that of the single ruler. In fact the fundamental natural frequency of the bolted double ruler is twice that of the single ruler. The damping ratios for the two cantilevers can be considered to be the same. Hence this demonstration verifies the concept that the higher the natural frequency of a structure, the quicker the decay of its free vibration.
<—Model 3—>
An overcritically-damped system
This demonstration shows the movement rather than the vibrations of an overcritically-damped beam subject to an initial displacement.
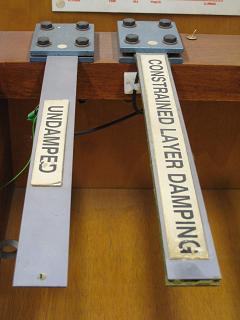
Fig. 15-10 shows two cantilever metal strips representing two cantilever beams. The one on the left is a conventional metal strip and the one on the right uses two metal strips with a layer of damping material constrained between the two strips. Apply the same initial displacement on the free ends of the two cantilevers and release them at the same time. It is observed that the cantilever on the right returns to its original position slowly without experiencing any vibration. This is the phenomenon of an overcritically-damped system described in Section 15.2.1 and Fig. 15-3.
<—Model 4—>
Mode shapes of a discrete model
This demonstration shows the two mode shapes of a discrete TDOF system.
15-11: Mode shapes of a TDOF model
Fig. 15-11 shows a two degree-of-freedom (TDOF) model that has two natural frequencies and two vibration modes. Apply initial horizontal displacements of the two masses in the same direction and then release them at the same time, the first mode of vibration is generated, Fig. 15-11a. Apply initial horizontal displacements of the two masses in opposite directions and then release them at the same time, the second mode of vibration is generated, Fig. 15-11b.
<—Model 5—>
Mode shapes of a continuous model
This demonstration shows the shapes of the first two modes of vibration of a continuous beam.
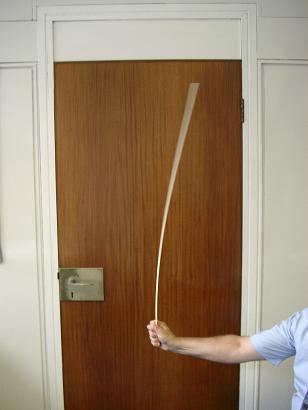
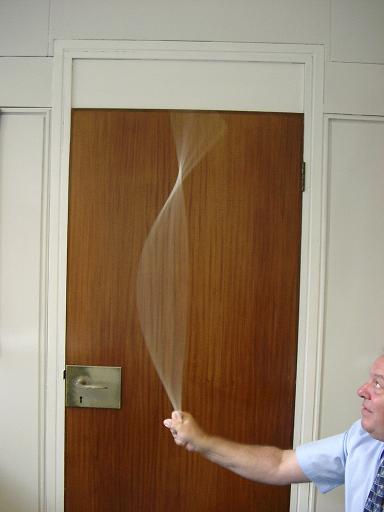
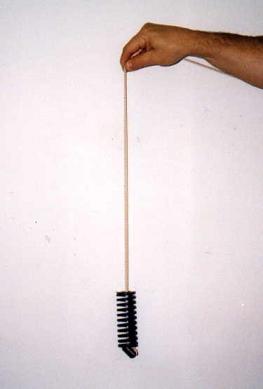
Fig. 15-12: Mode shapes of a cantilever
Take a long plastic strip and hold one end of the strip as shown in Fig. 15-12. Then move the hand forward and backward slowly, it generates the first mode of vibration as shown in Fig. 15-12a. Do the same but increase the speed of the movement, it excites the second mode of vibration as given in Fig. 15-12b. The two mode shapes of the strip are similar to those shown in Fig. 15-7.
<—Model 6—>
Tension force and natural frequency of a straight tension bar
This experiment verifies Eq. 15-38 and shows that the force in a tension bar can be predicted using natural frequency measurement.
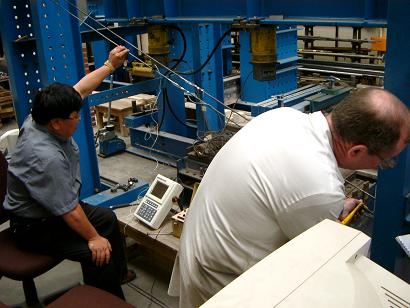
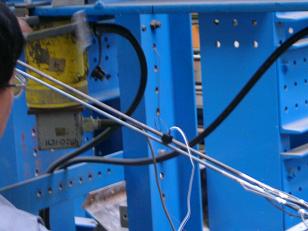
Fig. 15-13: Verification test of a tension bar
Two steel bars with different diameters (6mm and 8mm) and lengths (2.55m and 2.73m) were fixed to the steel frame shown in Fig. 15-13a. Two strain gauges were glued on each of the bars opposite to each other at the mid-points of the bars. Tension forces were applied by through turnbuckles at the ends of the bars, and the values of forces were determined through strain measurements. A small accelerometer was fixed to one of the two bars as shown in Fig.15-13b to record vibrations.
Vibration tests of the tension bars were conducted and accelerations were recorded when the bars were tensioned to different levels. Fundamental natural frequencies were determined from spectral analysis of the acceleration responses. For a range of measured fundamental natural frequencies Table 15-3 compares the measured tension forces in the 6mm tension bar and the forces predicted using Eq. 15-38 where the measured fundamental natural frequency values were taken. For predictions, the following values were used:
![]() ,
, ![]() and
and ![]() .
.
Table 15-3: Comparison of the measured and predicted tension forces for 6mm bar [15.5]
Experimental Results Experimental Results Prediction using Eq. 15-38 Prediction using Eq. 15-38 Natural frequency (Hz) Tension force ( kN ) Tension force
( kN )Relative error (%) 13.9 1.16 1.16 0.00 15.5 1.42 1.39 2.11 16.9 1.70 1.65 2.94 18.3 1.98 1.93 2.53 19.6 2.25 2.22 1.33 20.5 2.50 2.43 2.80 21.9 2.77 2.77 0.00 22.8 3.05 3.00 1.67
It can be seen from Table 15-3 that the tension forces in a tensioned bar can be predicted using Eq.15-38 and the natural frequency measurements.
<—Practical Examples—>
<—Example 1—>
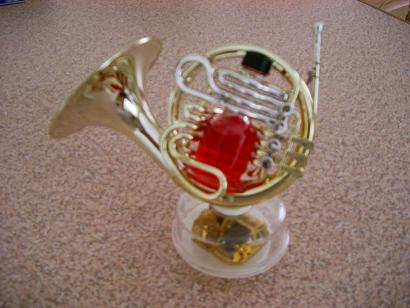
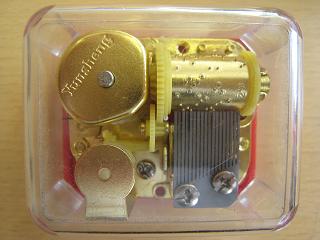
Fig. 15-14: A musical box and its core (The models are provided by Prof. B Zhuang, Zhejiang University, China)
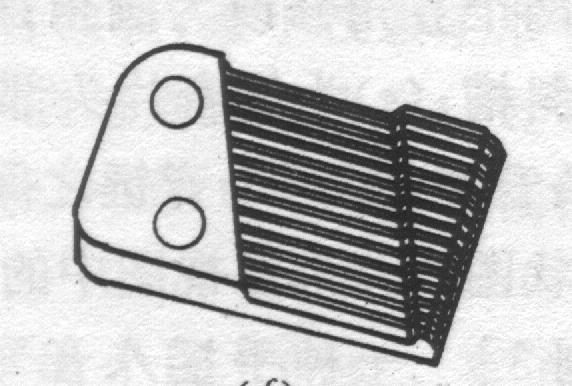
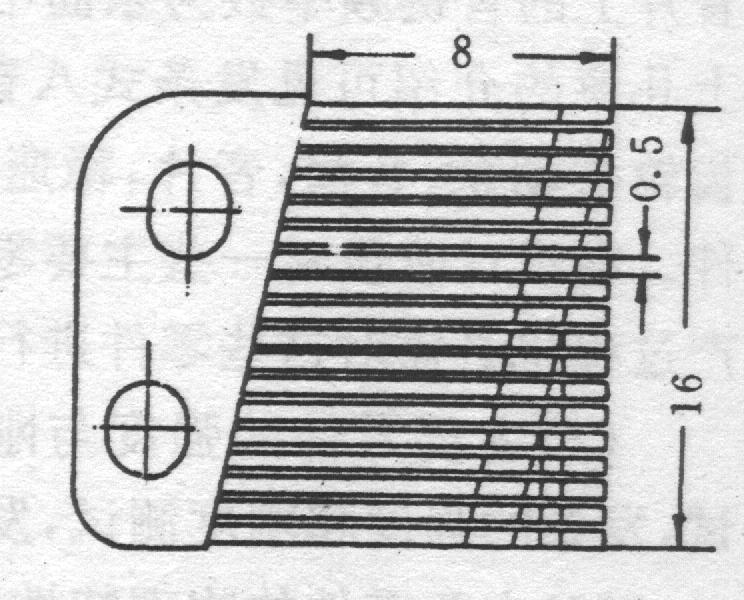
Fig. 15-15: Cantilever beams with different lengths and sections in the music box (mm)
A musical box is a device that produces music using mechanical vibration. Fig. 15-14a shows one of many decorative music boxes which are readily available. The core of the music box is the unit show in Fig. 15-14b.
A spring is used to rotate a music tube, converting the potential energy stored in the spring into the kinetic energy which drives the rotation of the tube. Raised points on the tube displace cantilever metal bars causing them to vibrate and generate sound. Different geometries (lengths and cross-sections) of the bars (see Fig. 15-15) provide different natural frequencies of the bars, generating different music notes. The distribution of the raised points on the tube is designed to create a particular music tune when the tube rotates. The music unit shown in Fig. 15-14b has eighteen metal bars generating eighteen different musical notes.
A given musical note relates to a particular natural frequency of the vibrating body. Table 15-4 gives the relationships between some natural frequencies and music notes.
Table 15-4: Relations between natural frequency and music note [15.6, 15.7]
Natural frequency (Hz) 261.6 293.7 329.6 349.2 392 440 493.9 Music note (Middle) C D E F G A B
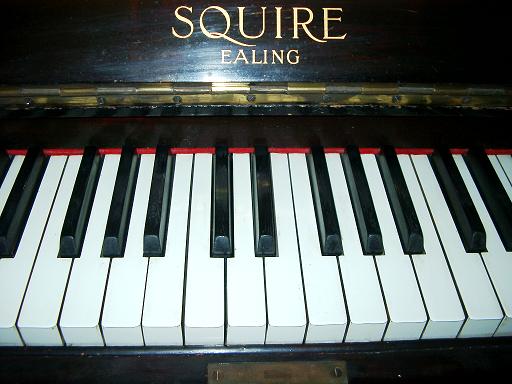
Fig. 15-16 shows part of the keyboard of a piano. The main reference point on a piano is known as Middle C. This is the white note located approximately in the centre of the keyboard and immediately to the left of a pair of black keys. Striking the Middle C key, the sound generated corresponds to a frequency of 262 Hz. The next white key, D, to the right of the Middle C key, produces a sound corresponding to a frequency of 294 Hz.
<—Example 2—>
Measurement of the fundamental natural frequency of a building through free vibration generated using vibrators
When the free vibrations of a structure can be measured as accelerations, velocities or displacements, the natural frequencies of the structure can be determined from their vibration time histories.
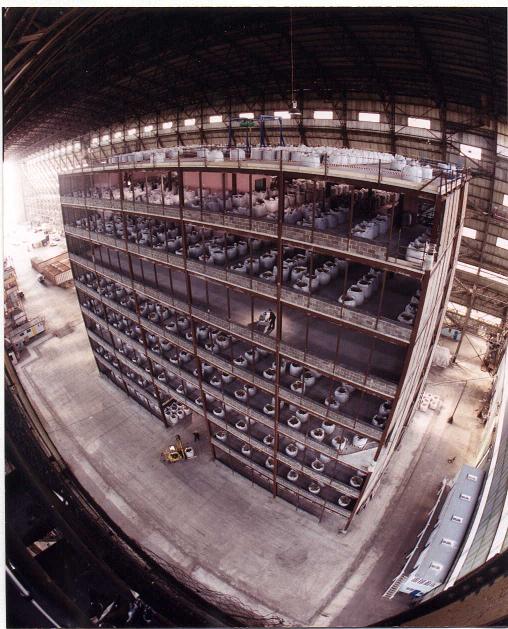
Fig. 15-17 shows an eight-storey steel framed test building in the Cardington Laboratory of the Building Research Establishment Ltd. Different dynamic test methods were used to determine the natural frequencies of this building. One of the methods used was to record the free vibrations of the building [15.8].
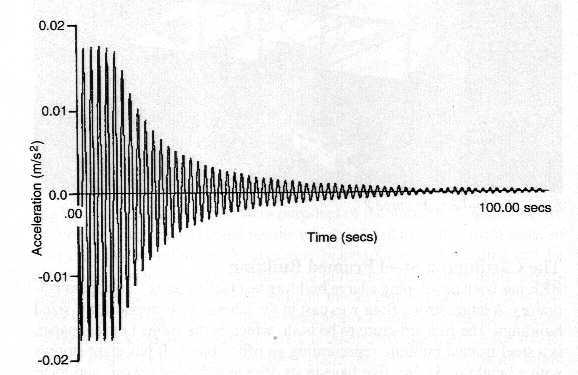
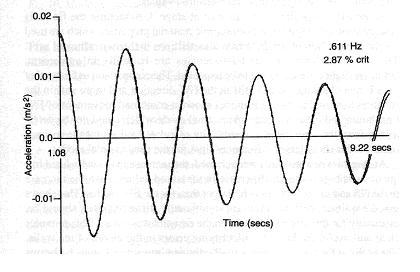
Four vibrators mounted at the corners of the roof of the building were used to generate movement of the structure. Once movement was initiated the vibrators were turned off and the resulting free vibrations of the structure were measured by accelerometers. Fig. 15-18 shows the acceleration-time history of the decayed vibrations. The frequency of the oscillations, which is a natural frequency of the structure, was determined from the time history as the inverse of the time interval between two successive acceleration peaks.
<—Example 3—>
Measurement of the natural frequencies of a stack through vibration generated by the environment

Environmental effects such as air movements around a structure can also induce vibrations, though such vibration may be very small. These types of vibration may not be exactly free vibration as they are caused by disturbances due to external effects, such as wind. However, the concept of free vibration can still be used to identify the natural frequencies of a structure.
Fig. 15-19 shows a 97.5m tall multiflare stack which can be used to burn off excess gases. A laser test system was set up approximately 100m from the stack to monitor the stack vibrations. Several velocity-time histories on selected measurement points of the stack were measured when wind was blowing.
The natural frequencies of 0.67 Hz and 0.73 Hz were measured which corresponded to the fundamental modes in the two orthogonal horizontal directions.
<—Example 4—>
The tension forces in the cables in the London Eye
The wheel of the London Eye is stiffened by cables as shown in Fig. 15-20. There are 16 rim rotation cables, each around 60mm thick. In addition, there are 64 spoke cables, which are all 70mm thick and are spun from 121 individual strands in layers. Part of the tension in the cables will be lost due to normal operations after a period of time. Thus the cables need to be re-tensioned to maintain their design values. It is not convenient to measure the tension force directly in each of the cables. Instead, transverse impact loads are applied to each cable to generate free vibrations, from which the fundamental natural frequency of the cable in the transverse direction can be determined. Using the measured fundamental natural frequency, the tension in each cable can be predicted using Eq. 15-38 or similar equations. Tension losses can then be identified and recovered.
<—Example 5—>
Example 5: A toilet seat-cover
When turning the seat cover of a toilet down, one has to hold the cover and move it down to the toilet seat. Otherwise, the cover would impact on the seat and generate a loud sound. How could this be avoided?
It is demonstrated in a video clip in Model 3 of this chapter that an over-critically damped steel strip returns to its original position slowly and smoothly without experiencing vibration. This concept has been developed and used to design the seat-covers of some modern toilets. The video below shows how the cover moves slowly and gradually to the toilet seat without holding it.
The principle is also used for closing doors and for closing the covers of pianos:
(Courtesy of Prof. B Zhuang, Zhejiang University, China)
<—References—>
References
15.1 Beards, C F, (1996), Structural Vibration: Analysis and Damping, Arnold, London, IBSN 0 340 64580 6.
15.2 Clough, R W and Penzien J, (1993), Dynamics of Structures, McGraw-Hill, New York, ISBN 0-07-11324-4.
15.3 Chopra, A K, (1995), Dynamics of Structures, Prentice Hall Inc, New Jersey, ISBN 0-13-521063-1.
15.4 Morse, P M, (1948), Vibration and Sound, Second Edition, McGraw-Hill Book Company, New York.
15.5 Tzima, K, (2003), Predicting tension of a stayed cable using frequency measurements, MSc Dissertation, UMIST, UK.
15.6 Zhuang, B, et al, (1996), Design of music boxes and vibration of tuning bars, New Times Press, China, ISBN 7-5042-0307-6.
15.7 White, H E and White, D H, (1980), Physics and Music – the science of musical sound, Saunders College, Philadelphia, ISBN 0-03-045246-5.
15.8 Ellis, B. R. and Ji, T., (1996), Dynamic testing and numerical modelling of the Cardington steel framed building from construction to completion, The Structural Engineer, Vol.74, No.11, pp.186-192.
<—Dynamics: Resonance—>
<—Definition and Concepts—>
Resonance
Resonance is a phenomenon which occurs when the vibration of a system tends to reach its maximum magnitude. The frequency corresponding to resonance is known as the resonance frequency of the system. When the damping of the system is small, the resonance frequency is approximately equal to the natural frequency of the system.
- The resonance frequency is related to the damping ratio, the input (loading or ground motion) and the selected measurement parameter (relative or absolute movement, displacement, velocity or acceleration).
- Increasing damping will effectively reduce the response of the structure at resonance.
For a single degree-of-freedom (SDOF) system subject to a harmonic input, such as a direct load or a base motion, there are three characteristics:
- The maximum dynamic displacement is close to the static displacement for a given load amplitude if the load frequency is less than a quarter of the natural frequency of the system.
- The maximum dynamic displacement is less than the static displacement if the load frequency is more than twice the natural frequency of the system.
- The maximum dynamic displacement is several times the static displacement if the load frequency is close to or matches the natural frequency of the system.
<—Model Demonstrations—>
<—Model 1—>
To see a resonant response, it requires an input device that can generate either harmonic base motion, such as a shaking table, or harmonic load, such as using a vibrator, together with a simple structure that has a natural frequency within the frequency range of the input.
Dynamic response of a SDOF system subject to harmonic support movements
This demonstration shows the observations obtained from Figs. 16-3 and 16-8, i.e. the relationship between the response of a SDOF system and the ratio of the frequency of input to the natural frequency of the system.
An elastic string and a mass can form a simple SDOF system as shown in Fig. 16-9. Hold the end of the string and move it up and down harmonically to simulate the harmonic support movement of the SDOF system. This corresponds to the model shown in Fig. 16-6. The movement of the mass can be described using Eq. 16-24, and the ratio of the maximum movement of the mass to that of the hand is shown in Fig. 16-8.
The dynamic phenomena shown in Fig. 16-8 can be demonstrated qualitatively as follows:
- The person holding the string first moves his/her hand slowly up-and-down, creating a situation where the frequency of the support (hand) movement is much smaller than the natural frequency of the SDOF system. It will be observed that the amplitude of movement of the mass is almost the same as those of the support (hand), as indicated by Fig. 16-8 when the frequency ratio is less than 0.25.
- When the hand moves up-and-down quickly, it creates a situation that the frequency of the hand movement is larger than the natural frequency of the system. It can be seen that the hand movements are much larger than the movements of the mass, as indicated in Fig. 16-8 when the frequency ratio is larger than 2.0.
- Finally, when the hand moves up-and-down at a frequency close to the natural frequency of the system, a situation is created in which resonance develops. It is observed that the movements of the mass are much larger than the hand movements, as indicated in Fig. 16-8 when the frequency ratio is near to unity.
<—Model 2—>
Effect of resonance
This demonstration shows that a cantilever experiences significant vibration at resonance.
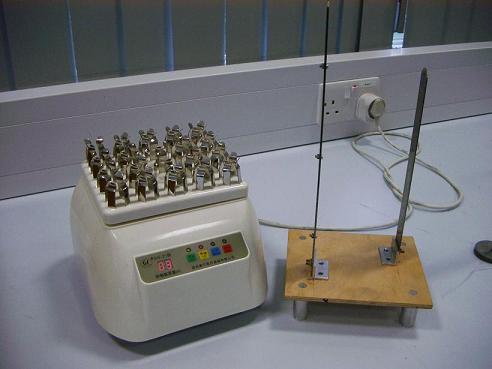
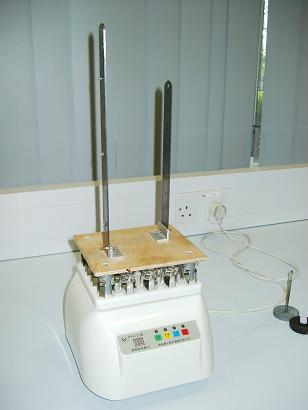
Fig. 16-10: Demonstration of resonance
Fig. 16-10a shows a medical shaker that can generate vibrations at a frequency of 5 Hz or 10 Hz in three perpendicular directions. A steel ruler and a longer and thicker steel ruler are mounted on a wooden plate that can be firmly placed on the shaker as shown in Fig. 16-10b. Both rulers are selected to have their fundamental natural frequencies slightly less than 5 Hz.
Switch on the shaker at the frequency of 10 Hz and it will be seen that the two rulers vibrate with very small amplitudes in comparison with the movement of the shaker.
Change the vibration frequency from 10 Hz to 5 Hz and it will then be observed that both rulers vibrate with significant amplitudes as the fundamental frequencies of the rulers are close to the shaking frequency.
<—Practical Examples—>
<—Example 1—>
In certain situations resonance should be avoided in civil engineering structures. This requires the knowledge of the natural frequencies of the structure and the frequencies of the dynamic loading applied to it.
The London Millennium Footbridge
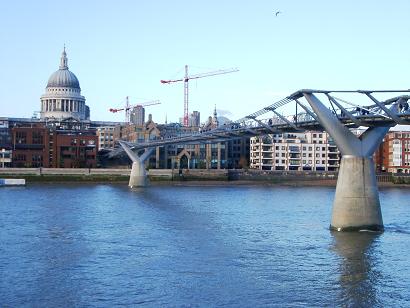
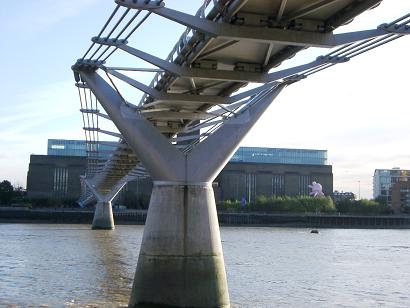
Fig. 16-11: The London Millennium Footbridge
The London Millennium Footbridge is the first new pedestrian bridge crossing over the Thames in Central London for more than a century. The bridge is located between Peter’s Hall on the north bank leading to Saint Paul’s Cathedral and the new Tate Modern Art Gallery on the south bank. The bridge has three spans over a total length of 325 metres. The lengths of the three spans are 81 metres for the north span, 144 metres for the main span and 100 metres for the south span.
The London Millennium Footbridge, Figure 16-11, opened on 10 June 2000. It was estimated that between 80,000 and 100,000 people crossed the bridge during the opening day with a maximum of 2000 people on the bridge at any one time. During the opening day unexpected lateral movements, or ‘wobbling’, occurred when people walked across the bridge. Two days later the bridge was officially closed in order to investigate the causes of the vibration. After investigation and modification, the bridge reopened in December 2001 [16.4]. Since then millions of people have visited the bridge and there has been no reoccurrence of ‘wobbling’ problems.
As constructed, the bridge had lateral natural frequencies as follows:
- South span: first lateral natural frequency was about 0.8Hz;
- Central span: first two lateral natural frequencies were about 0.5 and 0.95 Hz; and
- North span: first lateral natural frequency was about 1.0 Hz.
It was reported that excessive vibrations of the bridge in the lateral direction did not occur continuously but built up when a large number of pedestrians were on the south and central spans of the bridge and then died down if the number of people on the bridge reduced or if the people stopped walking [16.4].
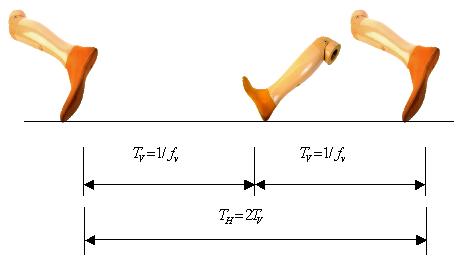
Resonance is related to forcing frequencies. Walking is a periodic movement on a flat surface in which two feet move alternately from one position to another and do not leave the surface simultaneously. When people walk in a normal way, walking has its own frequency. This is illustrated in Fig. 16-12.
When people walk, they produce vertical loading on the walking surface, such as floors and footbridges. The time from one vertical load generated by one foot to the next vertical load induced by the other foot is the period of the walking load in the vertical direction, denoted as ![]() . People walking generate not only vertical forces, but also lateral forces. The force generated laterally by the right foot is normally in the opposite direction to the force induced by the left foot. Therefore the time required for reproducing the same pattern of force can be counted from the left (or right) foot to the next step of the left (or right) foot. In other words, the period of lateral forces (
. People walking generate not only vertical forces, but also lateral forces. The force generated laterally by the right foot is normally in the opposite direction to the force induced by the left foot. Therefore the time required for reproducing the same pattern of force can be counted from the left (or right) foot to the next step of the left (or right) foot. In other words, the period of lateral forces ( ![]() ) is just twice the period of the vertical force induced by people walking, or the frequency of the lateral walking loads is a half of that of the vertical walking loads [16.5].
) is just twice the period of the vertical force induced by people walking, or the frequency of the lateral walking loads is a half of that of the vertical walking loads [16.5].
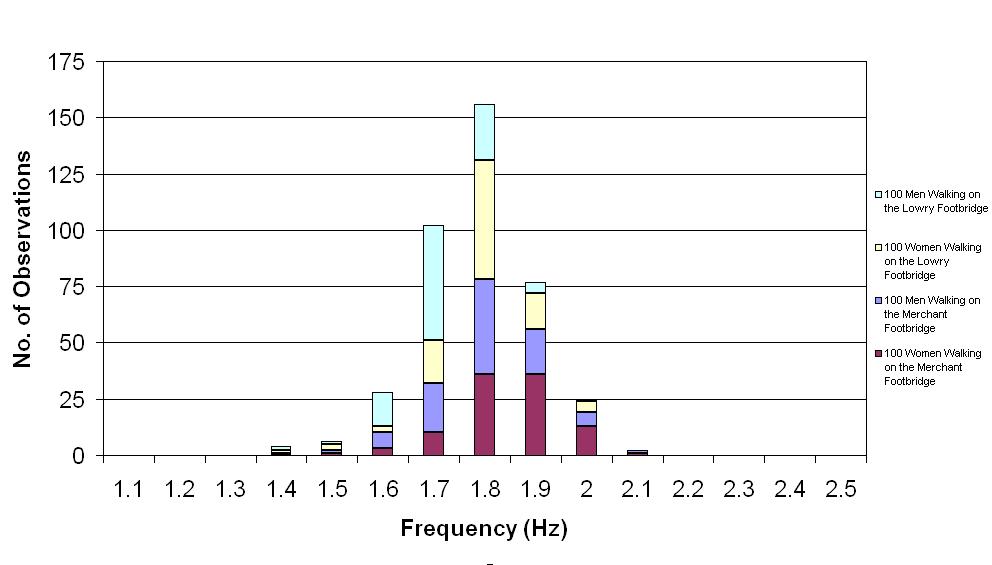
Fig. 16-13 shows the distribution of walking frequencies obtained from 400 people walking on two footbridges in Manchester [16.6]. The horizontal axis indicates the walking frequency in the vertical direction while the vertical axis shows the number of observations of particular frequencies. It can be seen from Fig. 16-13 that most of the 400 frequencies of people walking are between 1.6 Hz and 2.0 Hz in the vertical direction. As the walking frequency in the lateral direction is just half that in the vertical direction, the corresponding frequencies of people walking in the lateral direction are between 0.8 Hz and 1.0 Hz.
It can be noted that the frequencies of walking loads in the lateral directions were close to the lateral natural frequencies of the south and central spans of the London Millennium Footbridge where excessive vibrations occurred. It was also observed that people walking in large groups tended to synchronise their walking paces. When the footbridge started wobbling, more people would walk at the frequency of the wobbling, which enhanced the synchronisation. This synchronisation magnified the effect of the lateral footfall forces on the footbridge. The wobbling of the footbridge was caused by resonance that synchronisated the walking loads.
<—Example 2—>
Avoidance of resonance – design of structures used for pop concerts
British Standard BS 6399: Part 1, Loading for Buildings [16.7], introduced in September 1996, included a new section on synchronised dance loading. It stated that any structure that might be subjected to this form of loading should be designed in one of two ways: to withstand the anticipated dynamic loads or to avoid significant resonance effects. The first method requires dynamic analysis to assess the structural response to the loading in order to calculate a safety margin. The second method requires that the structure should be designed to be sufficiently stiff so that the lowest relevant natural frequency of the structure is above the range of load frequencies considered. The second approach is simpler and only requires the calculation of natural frequencies. However, both approaches need knowledge of the load frequencies.
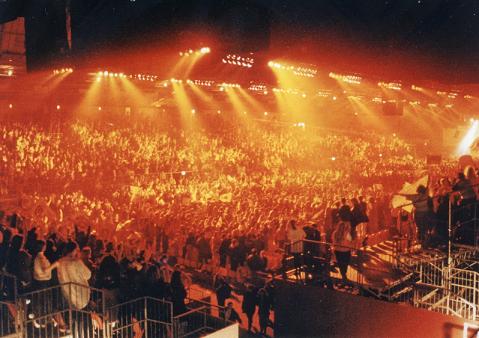
Dance-type activities, such as keep-fit exercises, aerobics and audience movements at pop-concerts, are more common now than ever before. These activities are likely to be held on grandstands, dance floors and in sports centres. Therefore, the use and/or design of these structures should consider the effect of the human induced dance-type loads. Fig.16-14 shows a pop concert where people moved, jumped, bobbed and swayed, in time to the music.
Dance is movement with rhythmic steps and actions, usually to accompanying music. Efforts have been made to study dance-type loads since prediction of the response of a structure subject to this loading requires an understanding of the loading. Dance-type loads are functions of the type of dance activity, the density and distribution of the dancers, the frequency of the music, load factors and the dynamic crowd effect.
There are many different types of dancing and a wide range of beat frequencies for dance music, however, dance frequencies tend to be in the range of 1.5-3.5Hz for individuals and 1.5-2.8Hz for groups of people.
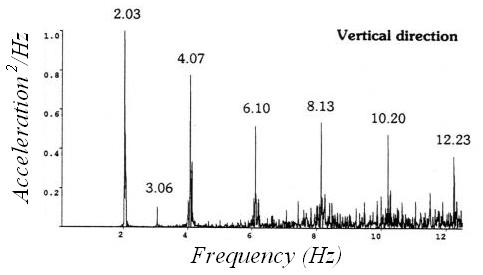
Fig. 16-15 shows an autospectrum obtained from accelerometers monitoring vertical motions of a grandstand during a pop concert [16.8]. The vertical axis indicates the normalised acceleration squared per Hz, while the horizontal axis shows frequency. It can be seen that the frequencies corresponding to the peaks of responses are the beat frequency of the music and integer multiples of the beat frequency. This phenomenon has been observed in a number of measurements taken during pop concerts and can be explained theoretically. As spectators at pop concerts move with the music beat, the frequency of dance-type loads can be determined from the beat frequency of music played on these occasions. The beat frequencies of 210 modern songs have been determined [16.9].
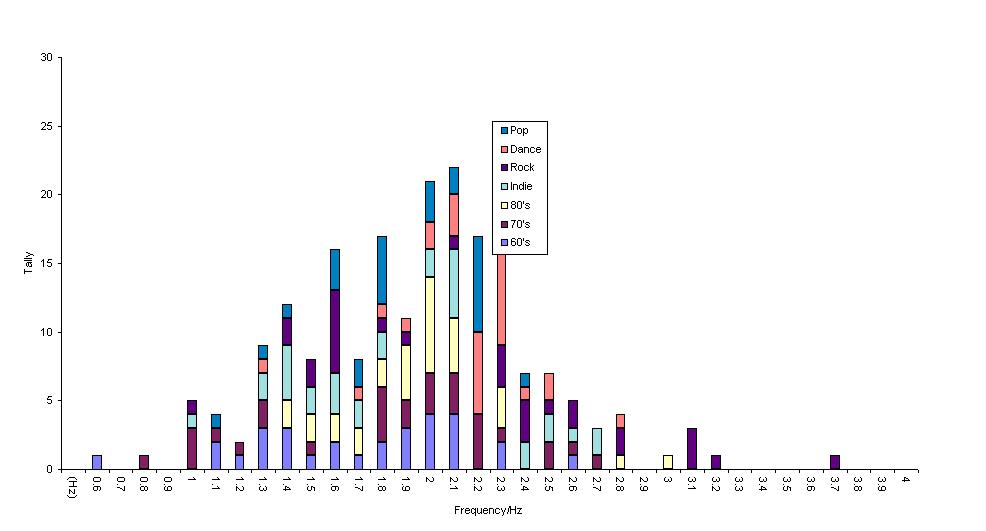
The 210 songs consisted of 30 songs from each of the 1960’s, the 1970’s and the 1980’s, and 120 songs from the 1990’s. The 1990s music was further classified into four main types, dance, indie, pop and rock, with 30 songs for each group. All the songs selected had been popular in their time and thus provided a good sample of popular music. The frequency distribution of the 210 songs surveyed is given in Fig. 16-16. It can be seen that the majority of songs (202 out of 210) are in the frequency range of 1.0 – 2.8 Hz.
Human loading, such as jumping, bobbing and walking, contains several harmonic components with the load frequency, two times the frequency, three times the frequency and so on. However, only the first two or three components are significant and need to be considered in design. For example, if the load or music frequency is not larger than 2.8 Hz and the first three load components are considered for a floor subject to jumping type loading, the highest frequency in the load to be considered will not be larger than 2.8 x 3 =8.4 Hz. This corresponds to the threshold value of natural frequency in BS6399: Part 1 of 8.4 Hz in the vertical direction, for which no dynamic analysis of the structure is required [16.7].
The video clip shows how severe the vibration of a grandstand is which was induced by spectators jumping during a football match.
(INSERT RESONANCE FOOTBALL STAND VIDEO HERE)
(Courtesy of Prof. M Kasperski, Ruhi-University Bochum, Germany)
<—Example 3—>
Measurement of the resonance frequency of a building
The concept of resonance can be used to identify the natural frequencies of a structure. A harmonic force with appropriate amplitude is applied to the structure and the corresponding maximum structural response is then recorded. The procedure is repeated a number of times with different forcing frequencies. The frequency corresponding to the largest value of these maximum responses is the resonant frequency of the structure. As civil engineering structures have damping ratios far less than 10%, the resonance frequency measured from the forced vibration is actually the natural frequency of the structure, as shown in Table 16-2.
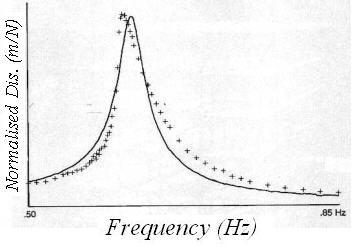
Among a number of experiments carried out on the test building shown in Fig. 15-17 were forced vibration tests with vibration generators used to shake the structure in a controlled manner at frequencies within the range 0.3 Hz to 20 Hz [16.10]. Four vibration generators were placed at the four corners of the roof of the building and the building response was monitored using accelerometers aligned to the measure motions in appropriate directions. The response of the building was sampled using optimised filtering, amplification and curve fitting and then normalised by converting the measured accelerations to equivalent displacements which were then divided by the applied forces. The maximum normalised displacement corresponding to a particular load frequency was plotted as a cross in Fig. 16-17. This process was repeated for a number of load frequencies to produce many crosses in Fig. 16-17, which are linked by a best-fit one degree-of-freedom curve. The frequency corresponding to the largest response is a resonance frequency of the structure. For this building the resonant frequency was 0.617 Hz in one main direction. This technique has been widely used in structural engineering, mechanical engineering and other areas.
<—Example 4—>
An entertaining resonance phenomenon


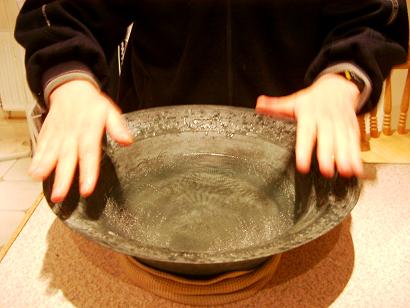
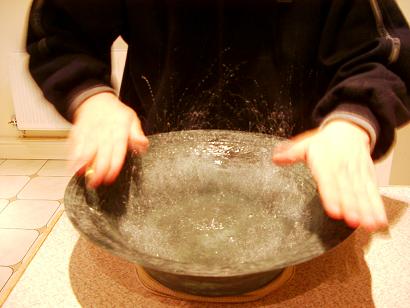
Figure 16-18: An entertaining resonance phenomenon
Fig. 16-18a shows a replica bronze washbowl which was used in ancient China. Four fish are cast into the bottom of the washbowl in an anti-clockwise direction around the centre of the base as shown in Fig. 16-18b. The washbowl is symmetric about the plane that passes through the centre of the bowl and is parallel to the two handles. Now, such bowls are used for entertainment, as the water in the washbowl can be made to spurt up to 300 mm into the air around the locations of the fishes’ mouths when two hands rub the handles on the washbowl. This effect can be produced as follows:
- The washbowl is filled half full with water and placed on a wet kitchen towel set in the shape of a ring of radius of about 80 mm.
- Clean two hands using soap and water and the palms are used to rub the handles of the washbowl as shown in Fig. 16-18c. The two palms move forward and backward alternatively and periodically, creating a pair of anti-symmetric periodical forces applied to the symmetrically located handles of the washbowl.
- Sound will generate from between the palms and the handles and ripples will form on the water surface (Fig. 16-18c).
- Continuing the hand movements will cause drops of water to jump out almost vertically from locations around the mouths of the fishes. Fig. 16-18d shows the situation when the resonance occurs.
Only small forces are applied to the two handles of the washbowl in the vertical and forward-backward directions. As the hands move periodically, resonance occurs when the frequency of hand movement matches one of the natural frequencies of the washbowl-water system. The evidence of the resonance is sound and ‘jumping water’.
INSERT resonance_pra4 VIDEO HERE
<—Example 5—>
Vibration of a hanging light
The video shows significant movement of a hanging light in a building. The building vibrated due to ground born vibration induced by vehicles nearby while the natural frequency of the hanging light, similar to a pendulum, coincided with a lateral natural frequency of the building. This generated significant movement of the hanging light even though the vibration of the building was very small and unnoticeable.
On the other hand, the hanging light acted as a pendulum tuned-mass-damper and its significant movement reduced insignificantly the lateral vibration of the building. A demonstration of such a phenomenon can be seen in the fourth model demonstration in Vibration Reduction.
INSERT C16-M5–Vhanging-light VIDEO HERE
<—Reference—>
References
16.1 Beards, C F, (1996), Structural Vibration: Analysis and Damping, Arnold, London, ISBN 0 340 64580 6.
16.2 Clough, R W and Penzien J, ( 1993), Dynamics of Structures, McGraw-Hill, New York, ISBN 0-07-11324-4.
16.3 Ji, T. and Wang, D., (2001), A supplementary condition for calculating periodical vibration, Journal of Sound and Vibration, Vol.241, No.5, pp.920-924.
16.4 Dallard, P, Fitzpatrick, A J, Flint,A, Le Bourva, S, Low, A, Ridsdill-Smith, R M and Willford, M, (2001) The London Millennium Footbridge, The Structural Engineer 79, pp.17-33.
16.5 Ellis, B R, (2001), Serviceability evaluation of floor vibration induced by walking loads, The Structural Engineer, Vol.79, No.21, pp.30-36.
16.6 Pachi, A and Ji, T., (2005), Frequency and velocity of walking people, The Structural Engineer, Vol. 83, No.3, pp.36-40.
16.7 BSI, (1996), BS 6399: Part 1: Loading for Buildings, London, ISBN 0 580 26239 1.
16.8 Littler, J. D., (1998), Full-scale testing of large cantilever grandstands to determine their dynamic response, Proceedings of the First International Conference on Stadia 2000, pp.123-134.
16.9 Ginty, D., Derwent, J. M. and Ji, T., (2001), The frequency ranges of dance-type loads, Journal of Structural Engineer, Vol.79, No.6, pp.27-31.
16.10 Ellis, B. R. and Ji, T., (1996), Dynamic testing and numerical modelling of the Cardington steel framed building from construction to completion, The Structural Engineer, Vol.74, No.11, pp.186-192.
<—Dynamics: Damping in Structures—>
<—Definitions and Concepts—>
Damping
- The larger the damping ratio,
 , the larger the ratio of successive peak displacements in free vibration (
  ), and the quicker the decay of oscillations.
 - The damping ratio can be determined from measurements using the vibration theory of a single degree-of-freedom system.
- The damping ratio is a measure of the amount of damping in a structure which can effectively reduce structural vibration at resonance.
- The higher the amplitude of free vibration of a structure, the larger will be the critical damping ratio and the smaller will be the natural frequency.
<—Model Demonstrations—>
<—Model 1—>
Observing the effect of damping in free vibrations
This set of models demonstrates the effect of damping provided by oil in free vibration, which can be observed by eyes.
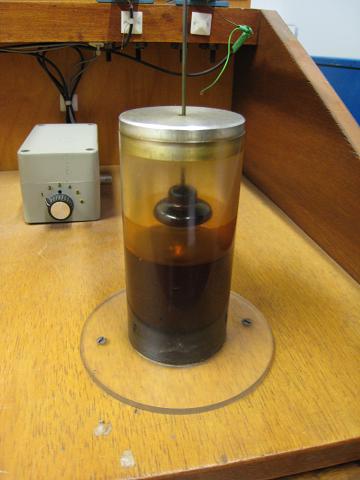
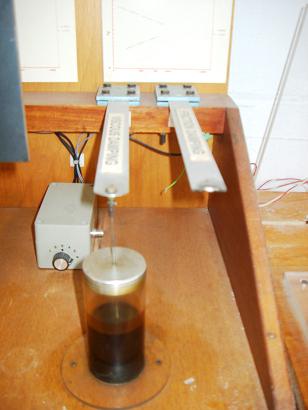
Fig. 17-2: Effect of the damping provided by oil.
Take a steel ruler and form a cantilever as shown in Fig. 15-9a. Give the tip of the ruler an initial displacement and release it. The steel ruler will perform many cycles of oscillation before it becomes stationary indicating that the damping ratio associated with steel alone is low.
Fig. 17-2a shows two identical steel strips acting as cantilevers. The only difference between the two cantilevers is that connected to the free end of the cantilever on the left is a vertical metal bar which in turn is attached to a disk immersed in oil. Fig. 17-2b shows the disk by lifting up the free end of the strip. Thus the effect of the oil and the device can be examined.
Press the free ends of the two cantilevers down by the same amount and then release them suddenly. It will be observed that the cantilever on the left only vibrates for a small number of cycles before stopping while the cantilever on the right oscillates through many cycles demonstrating the effect of viscous damping provided by the oil.
INSERT damping_mod1 VIDEO HERE
<—Model 2—>
Hearing the effect of damping in free vibration
This set of models shows the effect of damping provided by rubber bands in free vibration, which can be heard by ears.
The sound heard from the free vibrations of a taut string, such as a violin string, links two different physical phenomena, sound transmission and the string vibrations, which both can be described using the same differential equation of motion. Thus hearing sound can be related to observing free vibrations, in this case those of a taut string.
Fig. 17-3 shows two identical steel bars, one is a bare bar and the other has rubber bands wrapped around it. The effect of the damping added by the rubber can be demonstrated as follows:
- Suspend the bare bar and give it a knock at its lower end using the other metal bar as shown in Fig. 17-3a. A sound will be generated from the bar for several seconds as it reverberates.
- Suspend the wrapped bar and give it a similar knock on the exposed metal part (Fig. 17-3b). This time only a brief dull sound is heard as the rubber wrapping dissipates much of the energy of the vibration.
<—Practical Examples—>
<—Example 1—>
Damping ratio obtained from free vibration tests
The true damping characteristics of typical structural systems are normally very complex and difficult to define with few structures actually behaving as ideal single degree-of-freedom systems. Notwithstanding this, the earlier discussion of single degree-of-freedom systems can be useful when considering more complex practical structures.
A free vibration test was conducted on a full-sized eight-storey test building (Fig. 15-19) to identify the critical damping ratio of its fundamental mode [Ellis, B. R. and Ji, T., (1996)]. In order to amplify the displacements of the structure the building was shaken, by a set of vibrators mounted at the four corners on the roof of the building, at the fundamental frequency of the building. After the vibrators were suddenly stopped, the ensuing free vibrations of the roof of the building were measured. The decay of the vibrations in one of the two main directions of the building is shown in Fig. 15-18. As the excitation caused vibrations effectively only in the fundamental mode, the contributions of other modes of vibration to the decaying response of the structure were negligible.
Table 17-1: Natural frequency and damping ratio determined from various sections of decay
| Relative amplitude | Natural frequency (Hz) | Damping ratio (%) |
| 1.00 | 0.611 | 2.87 |
| 0.366 | 0.636 | 1.81 |
| 0.181 | 0.645 | 1.28 |
| 0.106 | 0.647 | 1.02 |
| 0.062 | 0.656 | 0.85 |
The natural frequency and damping ratio of the response of the structure can be determined from the records shown in Fig. 15-18. Five continuous 10s samples of vibrations were extracted from the response and a curve fitting technique was used to produce smooth curves from which the natural frequency and damping ratio could be determined. One such smoothed curve, superimposed on the measured curve, is shown in Fig. 17-4. The response frequency and damping ratio values extracted from the five samples are given in Table 17-1 and related to the amplitude of vibration at the start of each sample [Ellis, B. R. and Ji, T., (1996)].
From Table 17-1 it can be observed that:
- the higher the amplitude of vibration, the smaller the natural frequency and the larger the damping ratio,
- the natural frequency for the relative amplitude of 1.00 is 6.86% lower than that for the relative amplitude of 0.062 while the damping ratio at the relative amplitude of 1.00 is 238% higher than that at the relative amplitude of 0.062.
When the building vibrated with small amplitudes, the relative movements between joints and other connections in the structure were small involving frictional forces doing less work leading to lower damping ratios than were found when amplitudes were larger with associated larger relative joint movements and friction related work. These variations have been observed in many different types of structure.
<—Example 2—>
Damping ratio obtained from forced vibration tests
The forced vibration tests of the framed steel building for obtaining its resonance frequency are described in Section 16.4.3. The frequency spectrum obtained from the experiment and curve fitting are shown in Fig. 16-17.
The natural frequency and damping ratio obtained from the forced vibration tests were 0.617 Hz and 2.25% respectively. It can be noted that the measured values have a characteristic negative skew compared to the best-fit curve. This is typical of this type of measurement and shows one aspect of nonlinear behaviour as observed in free vibration tests of buildings and other structures.
It can be observed from Table 9-1 that the measurements from the forced vibration tests agree favourably with those obtained from the free vibration tests for relative amplitudes between 0.366 and 1.000. In general, forced vibration tests normally provide larger forces than free vibration tests. Therefore forced vibration tests frequently produce smaller values for natural frequencies and larger values for damping ratios than those obtained from free vibration tests.
<—Example 3—>
Reducing footbridge vibrations induced by walking
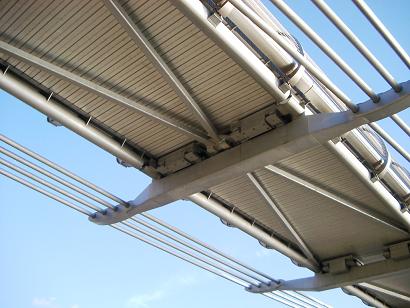
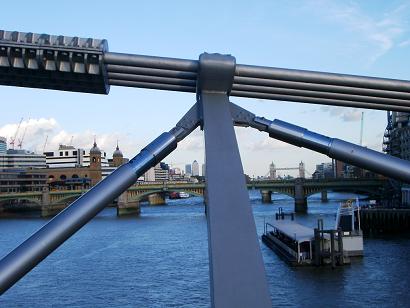
Damping devices installed on the London Millennium Footbridge
A total of 37 viscous dampers were installed on the London Millennium Footbridge in order to remove the lateral vibrations of the bridge which occured when people walked across the bridge. The majority of these dampers are situated beneath the bridge deck supported by transverse members (Fig. 17-5a). One end of each viscous damper is connected to the apex of a steel V brace, known as a chevron. The apex of the chevron is supported on roller bearings that provide vertical support but allow sliding in the other directions. The other ends of the chevron are fixed to the neighbouring transverse members [17.5]. Viscous dampers were also installed in the planes between the cables and the deck at the piers (Figure 17-5b) to provide damping of the lateral and lateral-torsional modes of vibration.
<—Example 4—>
Reducing floor vibration induced by walking
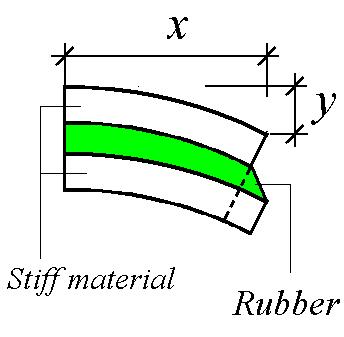
Damping can be introduced into concrete floors by sandwiching a layer of high damping material between the structural concrete floor and a protective concrete topping. This acts in a similar manner to the demonstration model described in Section 15.3.3.
During the bending of the floor induced by footfall vibrations, energy is dissipated through the shear deformation produced in the damping material by the relative deformations of the two concrete layers (Fig. 17-6). The technique was originally used to damp out vibrations of aircraft fuselage panels when the resonant frequencies of the panels were over 200 Hz.
A floor panel, 6 m by 9 m , in the steel-frame test building at the BRE Cardington Laboratory was selected for testing with and without damping layers (Fig. 17-7). A variety of comparative tests were conducted included heel-drop tests, forced vibration tests and walking tests at different paces.
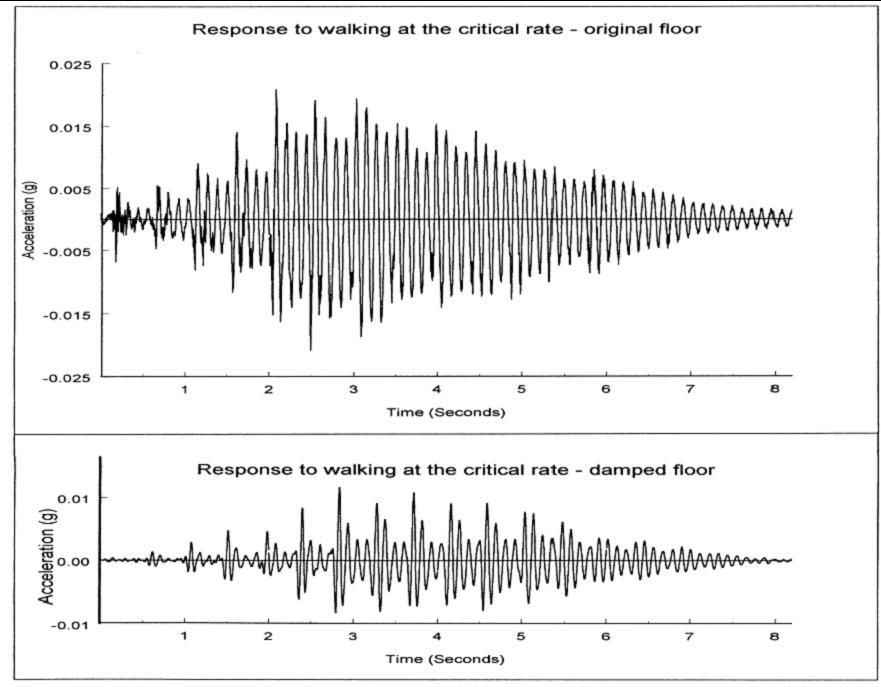
Fig. 17-8 shows the comparison of acceleration-time histories induced by the same individual walking on the floor panel without and with the damping layer. The benefit of the constrained damping layer in reducing the vibration of the floor is obvious.
<—References—>
References
17.1 Beards, C F, (1996), Structural Vibration: Analysis and Damping, Arnold, London, IBSN 0 340 64580 6.
17.2 Clough, R W and Penzien J, (1993), Dynamics of Structures, McGraw-Hill, New York, ISBN 0-07-11324-4.
17.3 Chopra A K, (1995), Dynamics of Structures, Prentice Hall Inc, New Jersey, ISBN 0-13-521063-1.
17.4 Ellis, B. R. and Ji, T., (1996), Dynamic testing and numerical modelling of the Cardington steel framed building from construction to completion, The Structural Engineer, Vol.74, No.11, pp.186-192.
17.5 Dallard, P, Fitzpatrick, A J, Flint,A, Le Bourva, S, Low, A, Ridsdill-Smith, R M and Willford, M, (2001) The London Millennium Footbridge, The Structural Engineer 79, pp.17-33.
<—Dynamics: Vibration Reduction—>
<—Definitions and Concepts—>
Vibration Reduction
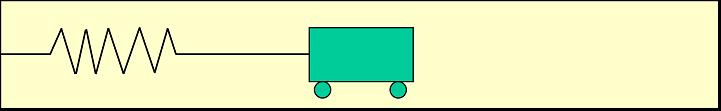
The dynamic vibration absorber (DVA) or tuned mass damper (TMD) is a device which can reduce the amplitude of vibration of a structure through interactive effects. A TMD consists of a mass, connected by means of an elastic element and a damping element to the structure.
- The amplitude of vibration of a structure at resonance can be effectively reduced through slightly increasing or reducing the natural frequency of the structure thus avoiding resonance from an input at a given frequency.
- The amplitude of vibration of a structure can be reduced through base isolation which changes the natural frequencies of the system.
- The amplitude of vibration of a particular mode of a structure can be effectively reduced using a tuned-mass-damper.
<—Model Demonstrations—>
<—Model 1—>
A tuned mass damper (TMD)
This demonstration compares free vibrations of a SDOF system and a similar system with a tuned mass damper, and shows the effect of the tuned mass damper in free vibration.
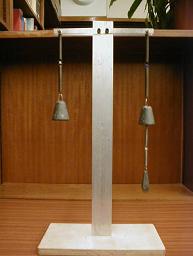
Fig. 18-5 shows a single degree of freedom (SDOF) system consisting of a mass and a spring attached to the left hand of a cross arm. The same SDOF system is attached to the right end of the cross arm and a smaller SDOF system has suspended from it. The smaller SDOF system, which is used as a tuned mass damper, has the same natural frequency as that of the main SDOF system. In other words, the ratio of stiffnesses of the two springs is the same as the ratio of the two masses.
Displace the two main SDOF systems downward vertically by the same amount and then release them simultaneously. It can be seen that the amplitude of vibration of the SDOF system on the left is greater than that of the one on the right. The tuned mass damper vibrates more than the mass to which it is attached. The vibration of the tuned mass damper applies a harmonic force to the SDOF system, which suppresses the movements of the main mass.
The effect of a tuned mass damper is most significant if a harmonic load is applied to the system with a frequency close to the natural frequency of the system.
<—Model 2—>
A tuned-liquid-damper (TLD)
This demonstration compares free vibrations of two SDOF systems, one with and one without water, and shows the effect of a tuned liquid damper in reducing free vibration.
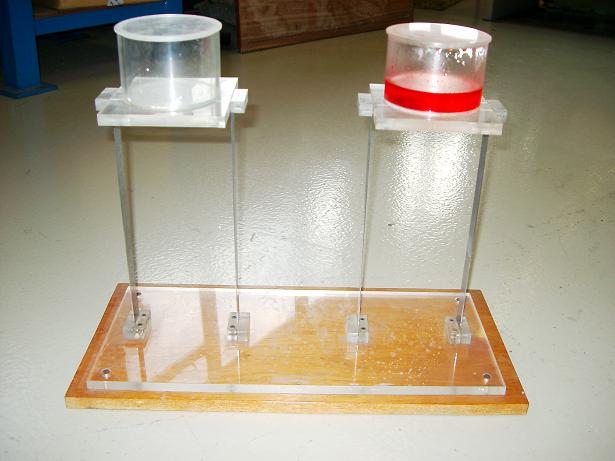
A tuned-liquid-damper (TLD) is basically a tank of liquid that can be tuned to slosh at the same frequency as the structure to which it is attached.
Two circular tanks are attached to the top of two identical flexible frames as shown in Fig. 18-6. The tank on the right is filled with some coloured water. The effect of water sloshing on the vibration of the supporting structure can be demonstrated as follows:
- Displace the tops of the two frames laterally by similar amounts.
- Release the two frames simultaneously and observe free vibrations of the two frames. The amplitude of vibration of the frame on the right decays much more quickly than that of the frame on the left.
The difference is due to the water sloshing in the tank and dissipating the energy of the system.
INSERT reduction_mod2 VIDEO HERE
<—Model 3—>
Vibration isolation
This demonstration compares forced vibrations of two glasses containing similar amount of water, one with and one without a plastic foam support, and shows the effect of base isolation.

A medical shaker can be used as a shaking table to generate harmonic base movements in three perpendicular directions. A glass is fixed directly to a wooden board while a similar glass is glued to a layer of plastic foam which is mounted on the wooden board, as shown in Fig. 18-7.
Fill the two glasses with similar amount of water. When the shaker moves at a pre-set frequency, it can be seen that the water in the glass on the plastic foam moves less than that in the other glass. The difference is due to the effect of the plastic foam, which isolates the base motion and also produces a natural frequency of the glass-water-foam system which is lower than that of the glass-water system and is thus farther away from the vibration frequency.
INSERT reduction_mod3 VIDEO HERE
<—Model 4—>
Model 4: A pendulum tuned-mass-damper
This demonstration shows the effect of a pendulum tuned-mass-damper on reducing vibrations at resonance. This effect has stimulated the use of a huge pendulum to reduce lateral vibrations of the 509m high Taipei 101 building.
A huge pendulum tuned-mass-damper is used in Taipei 101 to reduce the lateral vibrations of the building induced by wind or possible earthquakes. The principle of the vibration reduction can be demonstrated using a medical shaking table that can generate horizontal harmonic motion, two identical rulers to represent slender tall buildings and a string and a golf ball to model the pendulum.
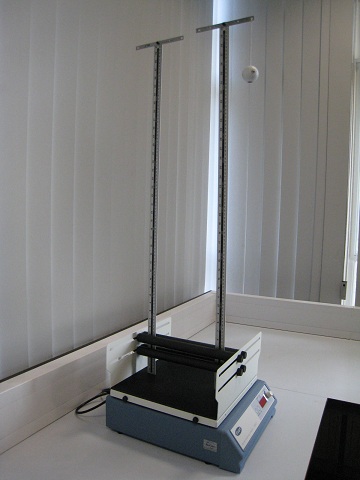
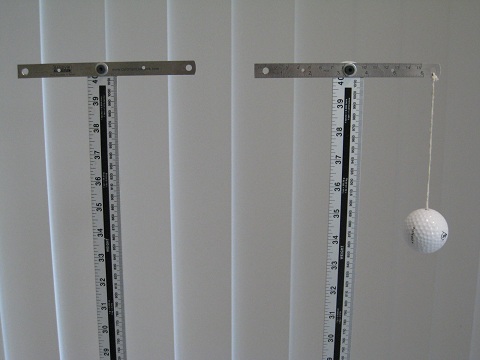
Figure 18.A1: A medical shaker and the test structures
Figure 18.A1 shows the set-up for the demonstration. The frequency of the movement of the shaker can be adjusted manually between 0 and 4 Hz. The two rulers (one with and one without a pendulum) are vertically placed on the shaking table and clamped at their lower parts using two horizontally placed members fixed to the shaker. Two identical small rulers are placed horizontally at the tops of the two rulers for hanging the pendulum and for making the two structures identical. It can be seen from Figure 18.A1 that the only difference between the two �structures� is that one is with and one without the pendulum � a string and a hollow golf ball. The length of the string is determined allowing that the pendulum has the same natural frequency as that of the cantilever ruler. The fundamental natural frequency of the cantilever is determined experimentally using the shaker when resonance occurs.
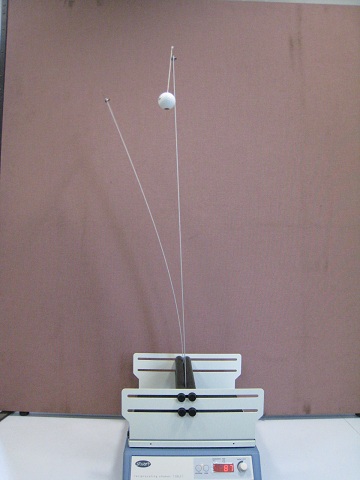
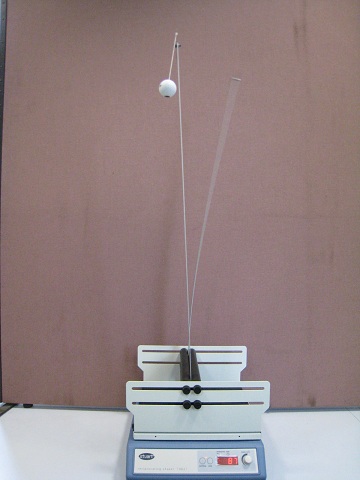
The efficiency of the pendulum tuned-mass-damper is demonstrated through the demonstration when the motion frequency of the shaker is close to the fundamental natural frequency of the ruler as shown in Figure 18.A2. It can be observed that:
- The ruler without a pendulum vibrates significantly and the magnitude of vibration is several times of that of the ruler with the pendulum.
- The pendulum vibrates more than the ruler where the pendulum is in place.
When sweeping the motion frequency of the shaker between 0 Hz and 4 Hz which cover the natural frequencies of the ruler-pendulum system, the phenomena of a two degrees-of-freedom system can be observed.
INSERT C18-M4-V VIDEO HERE
<—Practical Examples—>
<—Example 1—>
Tyres used for vibration isolation
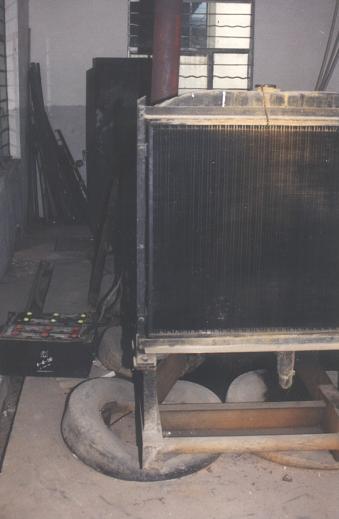
Fig. 18-8 shows two tyres placed between the ground and a generator in a rural area of a developing country. The presence of the tyres reduced the natural frequency of the generator and moving it away from the operating frequency. Although the operators of the generator may not have known much about vibration theory, they knew from experience that the presence of the tyres could reduce the level of vibration.
<—Example 2—>
The London Eye
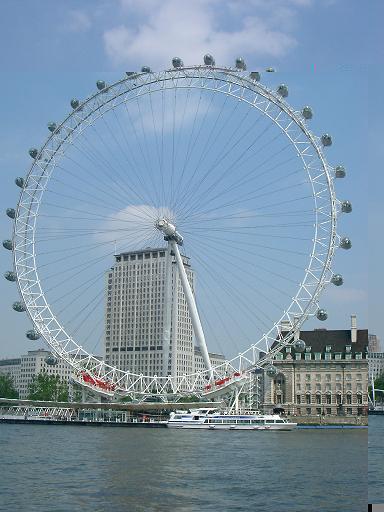
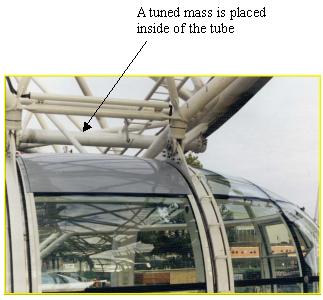
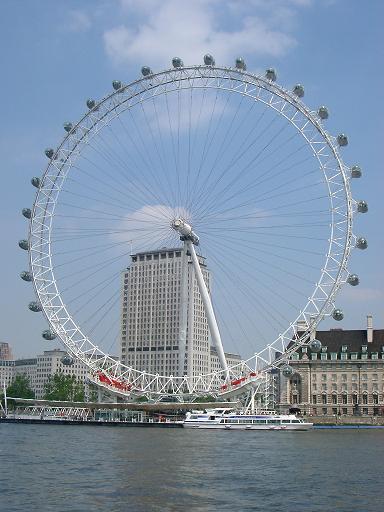
Fig. 18-9: The London Eye
The London Eye is the largest observation wheel in the world (Fig. 18-9a). It was built by the River Thames in the heart of London, just opposite to the Palace of Westminster. The wheel has a height of 135m and carries 32 capsules which can hold up to 800 people.
In order to reduce vibrations in the direction perpendicular to the plane of the wheel due to wind loads, 64 tuned mass dampers were installed in steel tubes which are uniformly distributed around the wheel. One of these tubes is indicated in Fig. 18-9b. The relation between the tuned mass damper and the tube is illustrated in Fig. 18-10. A mass and a spring in the tube were designed with a natural frequency close to the natural frequency of the wheel in the direction perpendicular to the plane of the wheel. Plenty of room is available in the tube to allow large movements of the tuned mass damper. No excessive vibration of the wheel has been observed in this direction since it was erected [18.4]
<—Example 3—>
The London Millennium Footbridge
A total of 26 pairs of vertical tuned mass dampers were installed over the three spans of the London Millennium Footbridge [18.5]. These comprise masses of between one and three tonnes supported on compression springs. The tuned mass dampers are situated on the top of the transverse arms beneath the deck. One pair of the tuned mass dampers is shown in Fig. 18-11.
These tuned mass dampers would become effective if the footbridge experienced relatively large vertical vibrations, though such vibrations were not the primary source of the well publicised problems when the bridge first opened.
<—References—>
References
18.1 Soong T T and Dargush G F, (1997), Passive Dissipation Systems in Structural Vibration, John Willy and Sons, New York, ISBN 0 471 96821 8.
18.2 Soong, T T (1990), Active Structural Control: Theory and Practice, Longman Scientific & Technical, Harlow, ISBN 0 470 21670 0.
18.3 Korenev, B G and Reznikov L M, (1993), Dynamic Vibration Absorbers, John Wiley and Sons, New York, ISBN 0471 92850 X.
18.4 Rattenbury, K, (2006), The Essential Eye, Harper Collins Publishers, London, ISBN 0 00 7728484.
18.5 Dallard, P, Fitzpatrick, A J, Flint,A, Le Bourva, S, Low, A, Ridsdill-Smith, R M and Willford, M, (2001) The London Millennium Footbridge, The Structural Engineer 79, pp.17-33.
<—Dynamics: Human Bodies Model in Structural Vibration—>
<—Definitions and Concepts—>
Human Body Models in Structural Vibration
- A stationary person, i.e one who is sitting or standing, acts as a mass-spring-damper rather than as an inert mass in both vertical and lateral structural vibration.
- A walking or jumping person acts solely as dynamic loading on structures and thereby induces structural vibration.
- A bouncing person acts as both dynamic loading and a mass-spring-damper on structures in vertical structural vibration.
<—Model Demonstrations—>
<—Model 1—>
The body model of a standing person in the vertical direction
The tests demonstrate that a standing person acts as a mass-spring-damper rather than an inert mass in vertical structural vibration while a walking or jumping person acts solely as loading on structures.
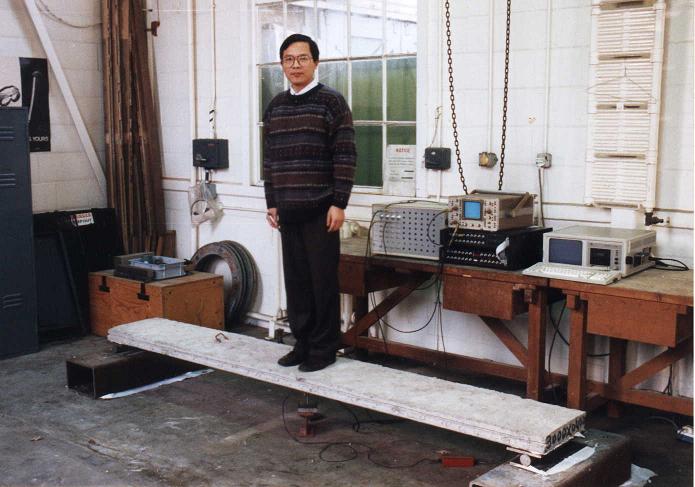
Fig. 19-6: Test set-up for identifying human body models in vertical structural vibration
Fig. 19-6a shows a simply supported reinforced concrete beam with an accelerometer placed at the centre of the beam. Striking the middle of the beam vertically with a rubber hammer caused vertical vibrations of the beam. The acceleration-time history recorded from the beam and the frequency spectrum abstracted from the record are shown in Figs. 19-7a and 19-7b. It can be observed that the simply supported beam has a vertical natural frequency of 18.7 Hz and the system has a very small damping ratio shown by the decay of the free vibrations which lasts more than eight seconds.
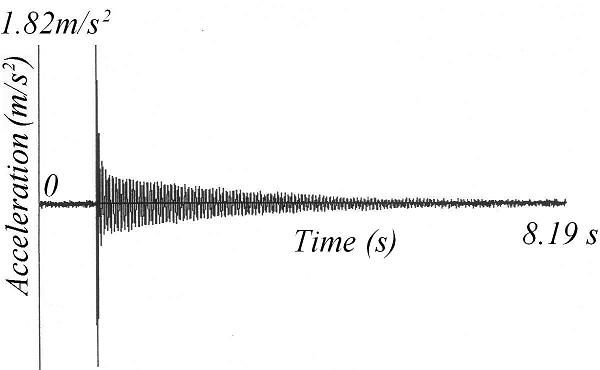
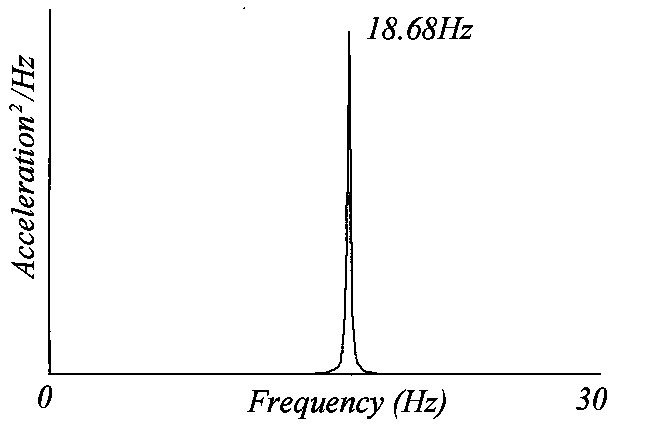
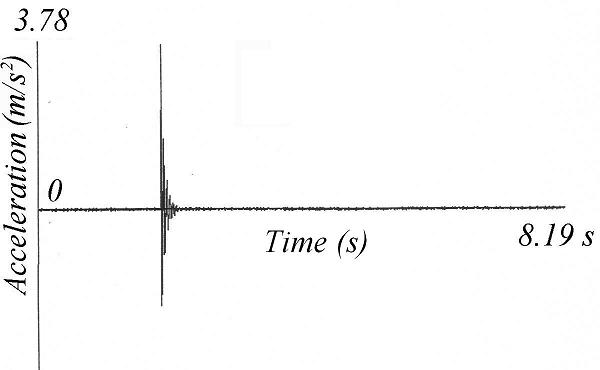
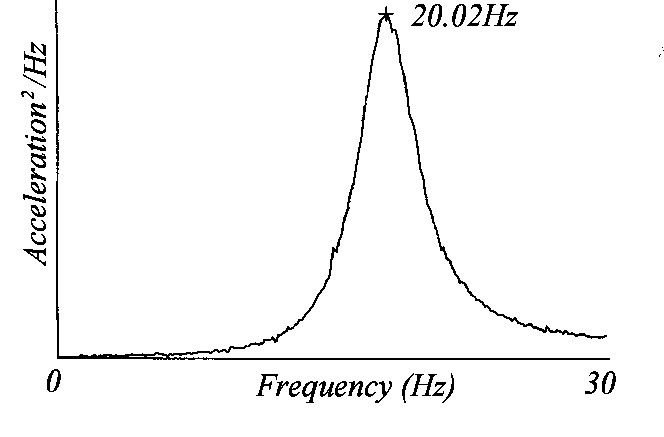
Fig. 19-7: Measurements of the identification tests in vertical directions [19.2]
A person then stood on the centre of the beam as shown in Fig. 19-6b and a human-structure system was created. A rubber hammer was again used to induce vibrations. Figs. 19-7c and 19-7d show the acceleration-time history and frequency spectrum of the beam with the person. Comparing the two sets of measurements in Fig. 19-7 shows that:
- the measured vertical natural frequency of the beam with the person was 20.0 Hz which is larger than that of the beam alone (Figs 19-7b and 19-7d). This observation coincides with Relationship 3, i.e.
 .
. - the beam with the person possesses a much larger damping ratio than the beam alone as the free vibration of the beam with the person decays very quickly (Fig. 19-7c). This is also evident from Fig. 19-7d as the peak in the spectrum of the beam with the person has a much wider spread than that of the beam alone (Fig. 19-7a).
Further tests were conducted to identify the effects qualitatively of human bodies in structural vibration, including tests on the beam with a dead weight and the beam occupied by a person who moved, both jumping and walking. The measured frequencies for these cases are listed in Table 19-1, which shows:
- the dead weights, which were placed centrally on the beam for two tests, reduced the natural frequency as expected. This can be accurately predicted using Eq. 19-1.
- the test with the person standing on the beam showed an increase in the measured natural frequency. This observation cannot be explained using the inert mass model or Eq. 19-1. Thus it is clear that the standing human body does not act as an inert mass in structural vibration.
- the measured frequency for the vibrations when the person sat on a stool on the beam was also higher than that of the beam alone.
- significant damping contributions from the human whole-body were observed for both standing and sitting positions, as can be appreciated from Fig. 19-7 for the standing person.
- jumping and walking also provided interesting results in that they did not affect either natural frequency or damping. The unchanged system characteristics would appear to be because the moving human body is not vibrating with the beam.
Table 19-1: Natural frequencies observed on the beam [19.2]
Description of experiments Measured natural frequency (Hz) Bare beam (Fig. 19-6a) 18.7 Beam plus a mass of 45.4 kg (100 lb) 15.8 Beam plus a mass of 90.8 kg (200 lb) 13.9 Beam with T. Ji standing (Fig. 19-6b) 20.0 Beam with T. Ji sitting on a high stool 19.0 Beam with T. Ji jumping on spot 18.7 Beam with T. Ji walking on spot 18.7
Two concepts can be identified from the above tests:
- A stationary person, e.g. sitting or standing, acts as a mass-spring-damper rather than as an inert mass in structural vibration.
- A walking or jumping person acts solely as loading on structures.
<—Model 2—>
The body model of a standing person in the lateral directions
The tests demonstrate that a standing person acts as a mass-spring-damper rather than an inert mass in lateral structural vibration [19.8].
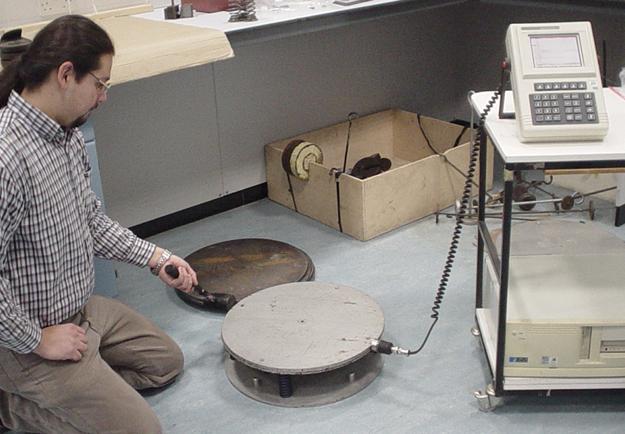
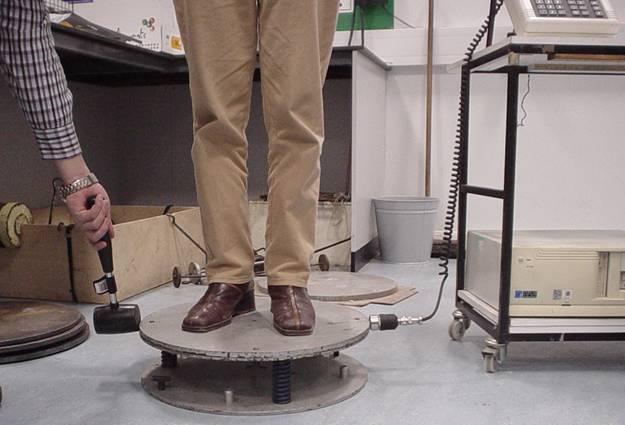
Fig. 19-8: Test set-up for identifying human body models in lateral structural vibration
Fig. 19-8a shows a single degree-of-freedom rig for both vertical and horizontal directions used for identification tests of human body models in structural vibration. The test rig consists of two circular top plates bolted together, three identical springs supporting the plates and a thick base plate. The test procedure is simple and is the same as that conducted in Section 19.3.1. The free vibration test of the test rig alone was first conducted using a rubber hammer to generate an impact on the rig in the lateral direction. Then a person stood on the test rig and an impact was applied in the lateral direction parallel to the shoulder of the test person as shown in Fig. 19-8b. Fig. 19-9 shows the displacement-time histories and the corresponding spectra of the test rig alone and the human-occupied test rig in the lateral directions. It can be noted from Fig. 19-9 that:
************** FIG 19-9 IMAGES MISSING **************
Fig. 19-9: Measurements of the identification tests in lateral directions
- The standing body contributes significant damping to the test rig in the lateral direction (Figs. 19-9a and 19-9c).
- There is one single resonance frequency recorded on the test rig alone (Fig. 19-9b) but two resonance frequencies are observed from the human-structure system in the lateral direction (Fig. 19-9d).
- The single resonance frequency of the test rig alone is between the two resonance frequencies of the human occupied test rig (Relationship 3 in Section 19.2.2)
- Human whole body damping in the lateral directions is large but less than that in the vertical direction as shown by the vibration time history of the human-structure system in the lateral directions which is longer than that in the vertical directions (Fig. 19-7c), although the test structures are different.
The experimental results of the identification tests conducted in the lateral directions clearly indicate that a standing human body acts in a similar manner to a mass-spring-damper rather than an inert mass in lateral structural vibration.
Further identification tests have been conducted on the same test rig with a bouncing person who maintains contact with the structure. It is observed that:
- A bouncing person acts as both loading and a mass-spring-damper on structures in vertical structural vibration.
- The interaction between a bouncing person and the test rig is less significant than that between a standing person and the test rig.
<—Practical Examples—>
<—Example 1—>
The effect of stationary spectators on a grandstand
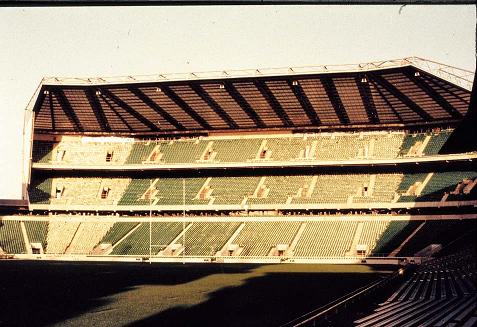
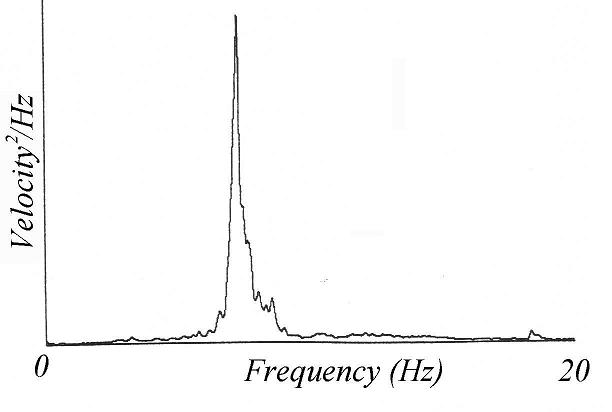
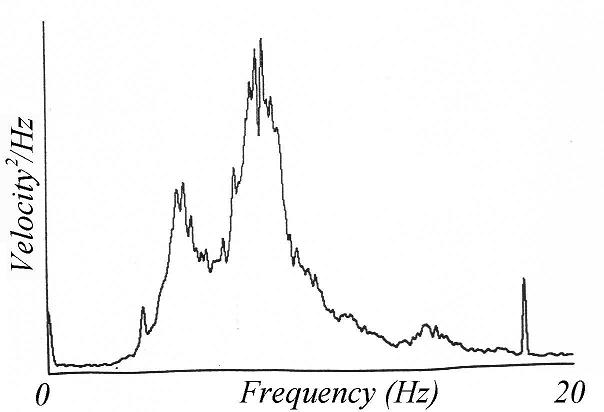
Fig. 19-11: Response spectra of the North Stand, Twickenham
Measurements were taken to determine the dynamic behaviour of the North Stand (Fig. 19-10) at the Rugby Football Union ground at Twickenham. The grandstand has three tiers and two of them are cantilevered. Dynamic tests were performed on the roof and cantilevered tiers of the stand, with further measurements of the response of the middle-cantilevered tier to dynamic loads induced by spectators during a rugby match [19.2].
Spectra for the empty and full grandstand are given in Fig 19-11. Fig. 19-11a shows a clearly defined fundamental mode of vibration for the empty structure. Instead of the expected reduction in natural frequency of the stand as the crowd assembled, the presence of the spectators appeared to result in the single natural frequency changing into a two natural frequencies (Fig. 19-11b). Fig. 19-11 shows that the dynamic characteristics of the grandstand changed significantly when a crowd was involved and that the structure and the crowd interacted. This pattern was also noted in two other locations of the stand where measurements were taken.
Comparing the spectra for the empty stand and fully occupied stand, three significant phenomena are apparent:
- an additional frequency was observed in the occupied stand.
- the natural frequency of the empty stand is between the two natural frequencies of the occupied stand.
- the damping increases significantly when people were presented.
Considering human bodies simply as masses cannot explain the above observations. The observations suggest that the crowd acted as a mass-spring-damper rather than just as a mass. When the crowd is modelled as a single degree-of-freedom system, the structure and the crowd form a two-degree-of-freedom system. Based on this model, the above observations can be explained. These observations complement the laboratory tests described in Section 19.3.
<—Example 2—>
Calculation of the natural frequencies of a grandstand

It is common for a grandstand, either permanent or temporary, to be full of spectators during a sports event or a pop concert as shown in Fig. 19-12. In this situation, the human mass can be of the same order as the mass of the structure. When calculating the natural frequencies of a grandstand for design purposes, it is necessary to consider how the human mass should be represented. It is recommended in BS6399: Part 1: Loading for Buildings [19.6] and the Interim Guidance [19.7] that empty structures should be used for calculating their natural frequencies. i.e., the human mass should not be included. This is because the worst situation for design consideration is when people move rather than when people are stationary. Therefore engineers will not under-estimate the natural frequencies of grandstands through adding the mass of a crowd to the structural mass.
<—Example 3—>
Dynamic response of a structure used at pop concerts
During a pop concert, it is rare that everyone moves in the same way following the music. Some people will move enthusiastically, jumping or bouncing, some will sway and some will remain stationary, either sitting or standing. Those who are stationary will provide significant damping to the structure as observed from the previous demonstrations and thus will alter the dynamic characteristics of the structure and effectively damp the level of vibration induced by the movements of the others. This in part explains why the predicted structural vibrations induced by human movements, where stationary people are not considered, are often much larger than vibrations measured on site.
The effect of stationary people in structural vibration has been considered in the new version of the Interim Design Guidance [19.7] for predicting the response of grandstands used for pop concerts.
<—Example 4—>
Indirect measurement of the fundamental natural frequency of a standing person
If a stationary person should be modelled as a single degree-of-freedom (SDOF) system in structural vibration, what are the natural frequency, damping ratio and the modal mass of the human SDOF system?
The natural frequency of a human body cannot be obtained directly using traditional methods and tools of structural dynamics, such as sensors (accelerometers) which cannot be conveniently mounted on a human body. However, a method has been developed to estimate the natural frequency of a standing person by experiment without touching the person whilst still using the methods of structural dynamics.
A simple formula can be derived based on the three frequency relationships derived in Section 19.2.2 using the measurements of the natural frequency of the empty structure and the resonance frequency/frequencies of the human-structure system as demonstrated in Section 19.3. For example, the demonstration given in Section 19.3.2 shows the natural frequency of the test rig alone of 6.10 Hz and the two resonance frequencies of the human-rig system of 5.20 Hz and 7.30 Hz respectively in Figure 19-9. Using Eq. 19-8 gives an estimated natural frequency of the standing person of 6.22 Hz in the lateral direction. It should be noted that this is an approximation because:
- the measurements in Fig. 19-9d are the resonance frequencies which include the effect of human body damping while Eq. 19-8 does not consider any effect of damping.
- the simple mass-spring-damper model is good enough for identifying the models of human body in structural vibration qualitatively. However, this body model is developed on fixed ground rather than on a vibrating structure.
The indirect measurement method needs to be improved; nevertheless it uses the methods of structural dynamics to study the biomechanics properties of a human body, which is fundamentally different from the methods of body biomechanics where shaking tables are used [19.9].
<—Example 5—>
Indirect measurement of the fundamental natural frequency of a chicken
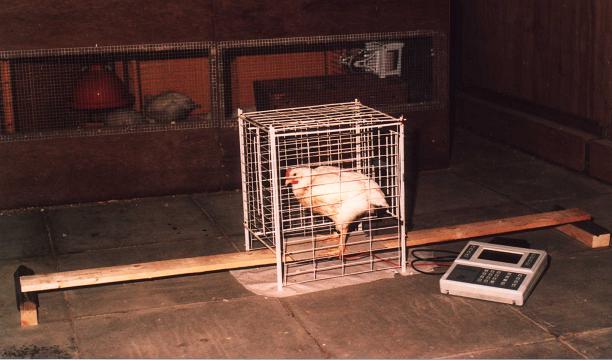
Six hundred million chickens are consumed each year in the UK. It has been observed sometimes during transportation that healthy chickens become ill and are unable to stand. Possible causes for this have been found to arise from the effect of resonance associated with the transportation.
In order to prevent the resonance in which a natural frequency of the truck matches the body natural frequency of chickens, the natural frequency of a typical chicken needs to be identified. When studying body biomechanics to determine the characteristics of a human body, a subject is asked to sit or to stand on a shaking table for a short period of vibration. However, this technique cannot be applied to studying the natural frequency of a chicken, as the chicken will fly off when the shaking table moves.
The method developed for indirectly measuring human body natural frequencies could be used to obtain the natural frequency of a chicken. Fig. 19-13 shows a chicken perched on a wooden beam. A slight impact on the beam can generate vibration of the beam and the chicken, which will not cause anxiety in the chicken. When the frequencies of the bare beam and the beam with the chicken are measured, the natural frequency of the chicken can be estimated from the two measurements and a simple equation.
<—References—>
19.1 Meriam, J. L. and Kraige, L. G., (1998), Engineering Mechanics, Vol.2: Dynamics, Fourth Edition, John Wiley & Sons, New York, ISBN 0-471-24167.
19.2 Ellis, B. R. and Ji, T., (1997), Human-structure interaction in vertical vibrations, Structures and Buildings, the Proceedings of Civil Engineers, Vol. 122, No.1, pp.1-9
19.3 Ji, T., (2000), On the combination of structural dynamics and biodynamics methods in the study of human-structure interaction, The 35th United Kingdom Group Meeting on Human Response to Vibration, Southampton, England, 13-15 September 2000.
19.4 Ji, T., (2003), Understanding the interactions between people and structures, The Structural Engineers, Vol.81, No.14, pp.12-13.
19.5 Griffin, M J, (1990), Handbook of Human Vibration, Academic Press Limited, London, ISBN 0-12-303040-4
19.6 BSI , (1996), BS 6399: Part 1: Loading for Buildings, London, ISBN 0 580 26239 1
19.7 Institution of Structural Engineers, (2001), Dynamic Performance Requirements for Permanent Grandstands Subject to Crowd Action -Interim Guidance on Assessment and Design, London, ISBN 0-901297-17-8, pp 1-22, Nov 2001.
19.8 Duarte E, Ji T, (2006), Measurement of human-structure interaction in vertical and lateral directions: a standing body, ISMA International Conference on Noise and Vibration Engineering, Leuven, Belgium.
19.9 Matsumoto, Y, Griffin, M, (2003), Mathematical models for the apparent masses of standing subjects exposed to vertical whole-body, Journal of Sound and Vibration, 260 (3), 431-451.