Resonance
Resonance is a phenomenon which occurs when the vibration of a system tends to reach its maximum magnitude. The frequency corresponding to resonance is known as the resonance frequency of the system. When the damping of the system is small, the resonance frequency is approximately equal to the natural frequency of the system.
- The resonance frequency is related to the damping ratio, the input (loading or ground motion) and the selected measurement parameter (relative or absolute movement, displacement, velocity or acceleration).
- Increasing damping will effectively reduce the response of the structure at resonance.
For a single degree-of-freedom (SDOF) system subject to a harmonic input, such as a direct load or a base motion, there are three characteristics:
- The maximum dynamic displacement is close to the static displacement for a given load amplitude if the load frequency is less than a quarter of the natural frequency of the system.
- The maximum dynamic displacement is less than the static displacement if the load frequency is more than twice the natural frequency of the system.
- The maximum dynamic displacement is several times the static displacement if the load frequency is close to or matches the natural frequency of the system.
Model Demonstrations
To see a resonant response, it requires an input device that can generate either harmonic base motion, such as a shaking table, or harmonic load, such as using a vibrator, together with a simple structure that has a natural frequency within the frequency range of the input.
Dynamic response of a SDOF system subject to harmonic support movements
This demonstration shows the observations obtained from Figs. 16-3 and 16-8, i.e. the relationship between the response of a SDOF system and the ratio of the frequency of input to the natural frequency of the system.
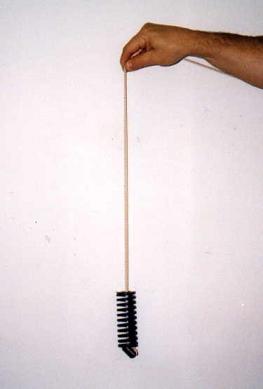
An elastic string and a mass can form a simple SDOF system as shown in Fig. 16-9. Hold the end of the string and move it up and down harmonically to simulate the harmonic support movement of the SDOF system. This corresponds to the model shown in Fig. 16-6. The movement of the mass can be described using Eq. 16-24, and the ratio of the maximum movement of the mass to that of the hand is shown in Fig. 16-8.
The dynamic phenomena shown in Fig. 16-8 can be demonstrated qualitatively as follows:
- The person holding the string first moves his/her hand slowly up-and-down, creating a situation where the frequency of the support (hand) movement is much smaller than the natural frequency of the SDOF system. It will be observed that the amplitude of movement of the mass is almost the same as those of the support (hand), as indicated by Fig. 16-8 when the frequency ratio is less than 0.25.
- When the hand moves up-and-down quickly, it creates a situation that the frequency of the hand movement is larger than the natural frequency of the system. It can be seen that the hand movements are much larger than the movements of the mass, as indicated in Fig. 16-8 when the frequency ratio is larger than 2.0.
- Finally, when the hand moves up-and-down at a frequency close to the natural frequency of the system, a situation is created in which resonance develops. It is observed that the movements of the mass are much larger than the hand movements, as indicated in Fig. 16-8 when the frequency ratio is near to unity.
Effect of resonance
This demonstration shows that a cantilever experiences significant vibration at resonance.
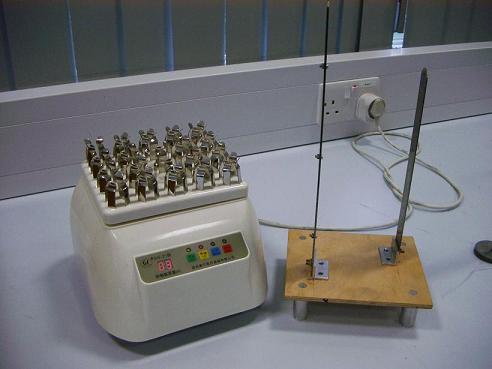
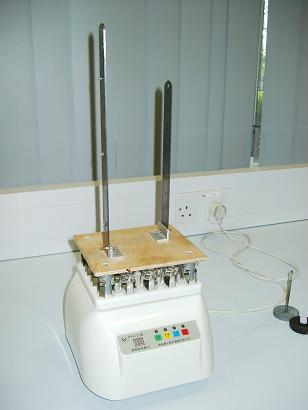
Fig. 16-10: Demonstration of resonance
Fig. 16-10a shows a medical shaker that can generate vibrations at a frequency of 5 Hz or 10 Hz in three perpendicular directions. A steel ruler and a longer and thicker steel ruler are mounted on a wooden plate that can be firmly placed on the shaker as shown in Fig. 16-10b. Both rulers are selected to have their fundamental natural frequencies slightly less than 5 Hz.
Switch on the shaker at the frequency of 10 Hz and it will be seen that the two rulers vibrate with very small amplitudes in comparison with the movement of the shaker.
Change the vibration frequency from 10 Hz to 5 Hz and it will then be observed that both rulers vibrate with significant amplitudes as the fundamental frequencies of the rulers are close to the shaking frequency.
Practical Examples
In certain situations resonance should be avoided in civil engineering structures. This requires the knowledge of the natural frequencies of the structure and the frequencies of the dynamic loading applied to it.
The London Millennium Footbridge
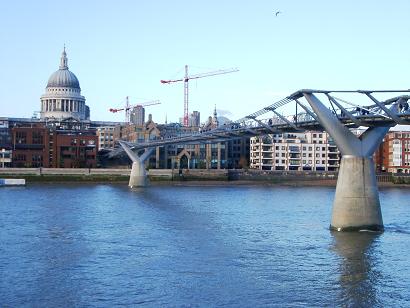
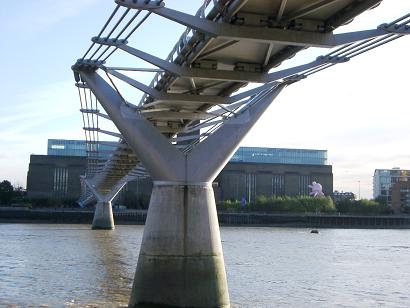
Fig. 16-11: The London Millennium Footbridge
The London Millennium Footbridge is the first new pedestrian bridge crossing over the Thames in Central London for more than a century. The bridge is located between Peter’s Hall on the north bank leading to Saint Paul’s Cathedral and the new Tate Modern Art Gallery on the south bank. The bridge has three spans over a total length of 325 metres. The lengths of the three spans are 81 metres for the north span, 144 metres for the main span and 100 metres for the south span.
The London Millennium Footbridge, Figure 16-11, opened on 10 June 2000. It was estimated that between 80,000 and 100,000 people crossed the bridge during the opening day with a maximum of 2000 people on the bridge at any one time. During the opening day unexpected lateral movements, or ‘wobbling’, occurred when people walked across the bridge. Two days later the bridge was officially closed in order to investigate the causes of the vibration. After investigation and modification, the bridge reopened in December 2001 [16.4]. Since then millions of people have visited the bridge and there has been no reoccurrence of ‘wobbling’ problems.
As constructed, the bridge had lateral natural frequencies as follows:
- South span: first lateral natural frequency was about 0.8Hz;
- Central span: first two lateral natural frequencies were about 0.5 and 0.95 Hz; and
- North span: first lateral natural frequency was about 1.0 Hz.
It was reported that excessive vibrations of the bridge in the lateral direction did not occur continuously but built up when a large number of pedestrians were on the south and central spans of the bridge and then died down if the number of people on the bridge reduced or if the people stopped walking [16.4].
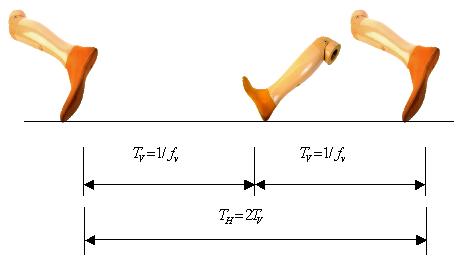
Resonance is related to forcing frequencies. Walking is a periodic movement on a flat surface in which two feet move alternately from one position to another and do not leave the surface simultaneously. When people walk in a normal way, walking has its own frequency. This is illustrated in Fig. 16-12.
When people walk, they produce vertical loading on the walking surface, such as floors and footbridges. The time from one vertical load generated by one foot to the next vertical load induced by the other foot is the period of the walking load in the vertical direction, denoted as ![]() . People walking generate not only vertical forces, but also lateral forces. The force generated laterally by the right foot is normally in the opposite direction to the force induced by the left foot. Therefore the time required for reproducing the same pattern of force can be counted from the left (or right) foot to the next step of the left (or right) foot. In other words, the period of lateral forces (
. People walking generate not only vertical forces, but also lateral forces. The force generated laterally by the right foot is normally in the opposite direction to the force induced by the left foot. Therefore the time required for reproducing the same pattern of force can be counted from the left (or right) foot to the next step of the left (or right) foot. In other words, the period of lateral forces ( ![]() ) is just twice the period of the vertical force induced by people walking, or the frequency of the lateral walking loads is a half of that of the vertical walking loads [16.5].
) is just twice the period of the vertical force induced by people walking, or the frequency of the lateral walking loads is a half of that of the vertical walking loads [16.5].
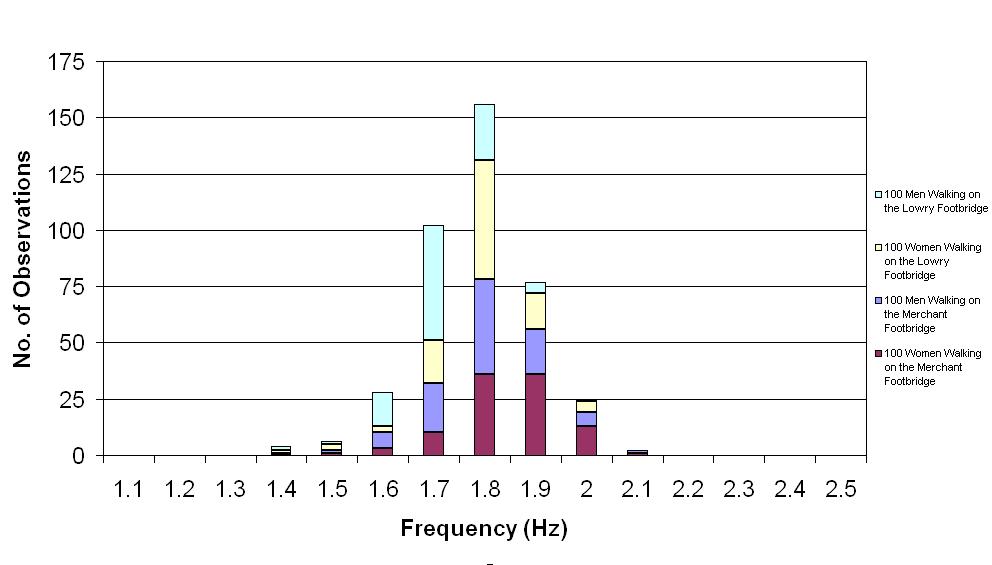
Fig. 16-13 shows the distribution of walking frequencies obtained from 400 people walking on two footbridges in Manchester [16.6]. The horizontal axis indicates the walking frequency in the vertical direction while the vertical axis shows the number of observations of particular frequencies. It can be seen from Fig. 16-13 that most of the 400 frequencies of people walking are between 1.6 Hz and 2.0 Hz in the vertical direction. As the walking frequency in the lateral direction is just half that in the vertical direction, the corresponding frequencies of people walking in the lateral direction are between 0.8 Hz and 1.0 Hz.
It can be noted that the frequencies of walking loads in the lateral directions were close to the lateral natural frequencies of the south and central spans of the London Millennium Footbridge where excessive vibrations occurred. It was also observed that people walking in large groups tended to synchronise their walking paces. When the footbridge started wobbling, more people would walk at the frequency of the wobbling, which enhanced the synchronisation. This synchronisation magnified the effect of the lateral footfall forces on the footbridge. The wobbling of the footbridge was caused by resonance that synchronisated the walking loads.
Avoidance of resonance – design of structures used for pop concerts
British Standard BS 6399: Part 1, Loading for Buildings [16.7], introduced in September 1996, included a new section on synchronised dance loading. It stated that any structure that might be subjected to this form of loading should be designed in one of two ways: to withstand the anticipated dynamic loads or to avoid significant resonance effects. The first method requires dynamic analysis to assess the structural response to the loading in order to calculate a safety margin. The second method requires that the structure should be designed to be sufficiently stiff so that the lowest relevant natural frequency of the structure is above the range of load frequencies considered. The second approach is simpler and only requires the calculation of natural frequencies. However, both approaches need knowledge of the load frequencies.
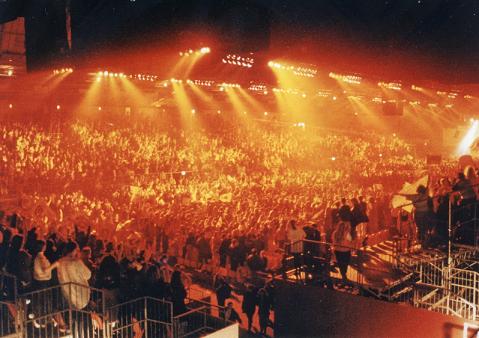
Dance-type activities, such as keep-fit exercises, aerobics and audience movements at pop-concerts, are more common now than ever before. These activities are likely to be held on grandstands, dance floors and in sports centres. Therefore, the use and/or design of these structures should consider the effect of the human induced dance-type loads. Fig.16-14 shows a pop concert where people moved, jumped, bobbed and swayed, in time to the music.
Dance is movement with rhythmic steps and actions, usually to accompanying music. Efforts have been made to study dance-type loads since prediction of the response of a structure subject to this loading requires an understanding of the loading. Dance-type loads are functions of the type of dance activity, the density and distribution of the dancers, the frequency of the music, load factors and the dynamic crowd effect.
There are many different types of dancing and a wide range of beat frequencies for dance music, however, dance frequencies tend to be in the range of 1.5-3.5Hz for individuals and 1.5-2.8Hz for groups of people.
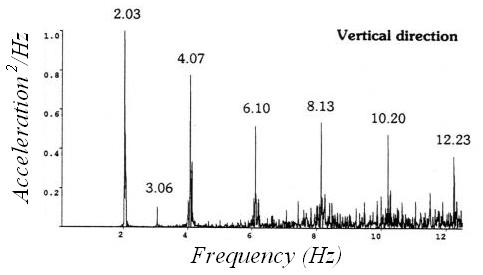
Fig. 16-15 shows an autospectrum obtained from accelerometers monitoring vertical motions of a grandstand during a pop concert [16.8]. The vertical axis indicates the normalised acceleration squared per Hz, while the horizontal axis shows frequency. It can be seen that the frequencies corresponding to the peaks of responses are the beat frequency of the music and integer multiples of the beat frequency. This phenomenon has been observed in a number of measurements taken during pop concerts and can be explained theoretically. As spectators at pop concerts move with the music beat, the frequency of dance-type loads can be determined from the beat frequency of music played on these occasions. The beat frequencies of 210 modern songs have been determined [16.9].
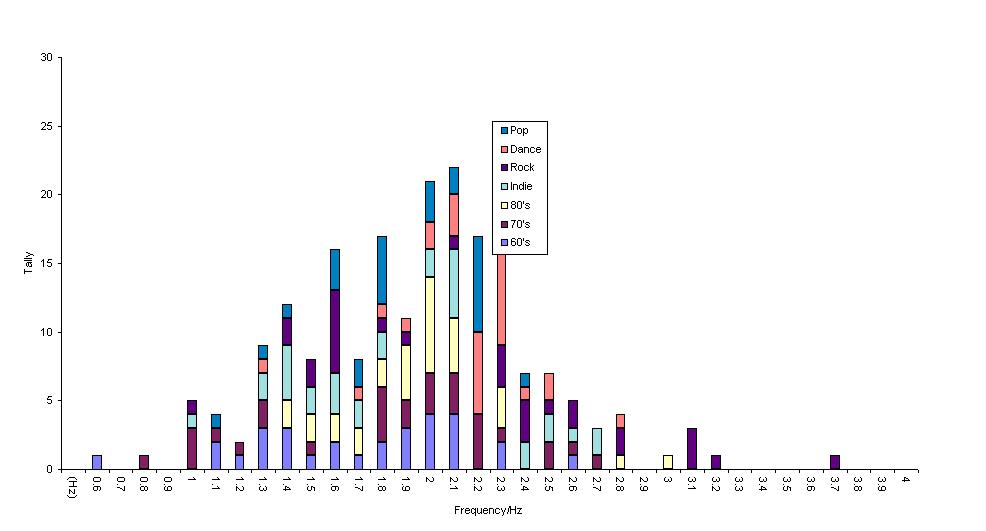
The 210 songs consisted of 30 songs from each of the 1960’s, the 1970’s and the 1980’s, and 120 songs from the 1990’s. The 1990s music was further classified into four main types, dance, indie, pop and rock, with 30 songs for each group. All the songs selected had been popular in their time and thus provided a good sample of popular music. The frequency distribution of the 210 songs surveyed is given in Fig. 16-16. It can be seen that the majority of songs (202 out of 210) are in the frequency range of 1.0 – 2.8 Hz.
Human loading, such as jumping, bobbing and walking, contains several harmonic components with the load frequency, two times the frequency, three times the frequency and so on. However, only the first two or three components are significant and need to be considered in design. For example, if the load or music frequency is not larger than 2.8 Hz and the first three load components are considered for a floor subject to jumping type loading, the highest frequency in the load to be considered will not be larger than 2.8 x 3 =8.4 Hz. This corresponds to the threshold value of natural frequency in BS6399: Part 1 of 8.4 Hz in the vertical direction, for which no dynamic analysis of the structure is required [16.7].
The video clip shows how severe the vibration of a grandstand is which was induced by spectators jumping during a football match.
(Courtesy of Prof. M Kasperski, Ruhi-University Bochum, Germany)
Measurement of the resonance frequency of a building
The concept of resonance can be used to identify the natural frequencies of a structure. A harmonic force with appropriate amplitude is applied to the structure and the corresponding maximum structural response is then recorded. The procedure is repeated a number of times with different forcing frequencies. The frequency corresponding to the largest value of these maximum responses is the resonant frequency of the structure. As civil engineering structures have damping ratios far less than 10%, the resonance frequency measured from the forced vibration is actually the natural frequency of the structure, as shown in Table 16-2.
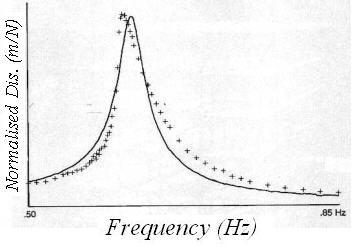
Among a number of experiments carried out on the test building shown in Fig. 15-17 were forced vibration tests with vibration generators used to shake the structure in a controlled manner at frequencies within the range 0.3 Hz to 20 Hz [16.10]. Four vibration generators were placed at the four corners of the roof of the building and the building response was monitored using accelerometers aligned to the measure motions in appropriate directions. The response of the building was sampled using optimised filtering, amplification and curve fitting and then normalised by converting the measured accelerations to equivalent displacements which were then divided by the applied forces. The maximum normalised displacement corresponding to a particular load frequency was plotted as a cross in Fig. 16-17. This process was repeated for a number of load frequencies to produce many crosses in Fig. 16-17, which are linked by a best-fit one degree-of-freedom curve. The frequency corresponding to the largest response is a resonance frequency of the structure. For this building the resonant frequency was 0.617 Hz in one main direction. This technique has been widely used in structural engineering, mechanical engineering and other areas.
An entertaining resonance phenomenon
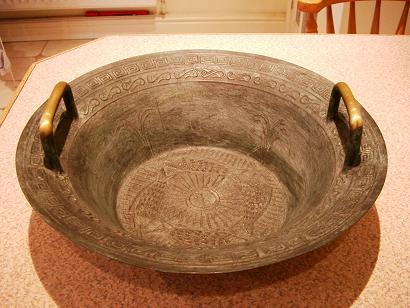

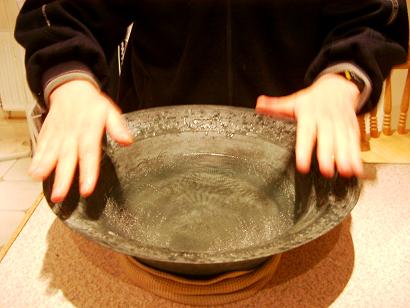
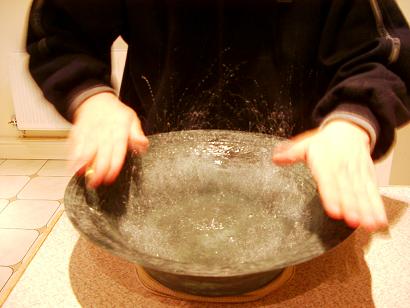
Figure 16-18: An entertaining resonance phenomenon
Fig. 16-18a shows a replica bronze washbowl which was used in ancient China. Four fish are cast into the bottom of the washbowl in an anti-clockwise direction around the centre of the base as shown in Fig. 16-18b. The washbowl is symmetric about the plane that passes through the centre of the bowl and is parallel to the two handles. Now, such bowls are used for entertainment, as the water in the washbowl can be made to spurt up to 300 mm into the air around the locations of the fishes’ mouths when two hands rub the handles on the washbowl. This effect can be produced as follows:
- The washbowl is filled half full with water and placed on a wet kitchen towel set in the shape of a ring of radius of about 80 mm.
- Clean two hands using soap and water and the palms are used to rub the handles of the washbowl as shown in Fig. 16-18c. The two palms move forward and backward alternatively and periodically, creating a pair of anti-symmetric periodical forces applied to the symmetrically located handles of the washbowl.
- Sound will generate from between the palms and the handles and ripples will form on the water surface (Fig. 16-18c).
- Continuing the hand movements will cause drops of water to jump out almost vertically from locations around the mouths of the fishes. Fig. 16-18d shows the situation when the resonance occurs.
Only small forces are applied to the two handles of the washbowl in the vertical and forward-backward directions. As the hands move periodically, resonance occurs when the frequency of hand movement matches one of the natural frequencies of the washbowl-water system. The evidence of the resonance is sound and ‘jumping water’.
Vibration of a hanging light
The video shows significant movement of a hanging light in a building. The building vibrated due to ground born vibration induced by vehicles nearby while the natural frequency of the hanging light, similar to a pendulum, coincided with a lateral natural frequency of the building. This generated significant movement of the hanging light even though the vibration of the building was very small and unnoticeable.
On the other hand, the hanging light acted as a pendulum tuned-mass-damper and its significant movement reduced insignificantly the lateral vibration of the building. A demonstration of such a phenomenon can be seen in the fourth model demonstration in Vibration Reduction.
References
16.1 Beards, C F, (1996), Structural Vibration: Analysis and Damping, Arnold, London, ISBN 0 340 64580 6.
16.2 Clough, R W and Penzien J, ( 1993), Dynamics of Structures, McGraw-Hill, New York, ISBN 0-07-11324-4.
16.3 Ji, T. and Wang, D., (2001), A supplementary condition for calculating periodical vibration, Journal of Sound and Vibration, Vol.241, No.5, pp.920-924.
16.4 Dallard, P, Fitzpatrick, A J, Flint,A, Le Bourva, S, Low, A, Ridsdill-Smith, R M and Willford, M, (2001) The London Millennium Footbridge, The Structural Engineer 79, pp.17-33.
16.5 Ellis, B R, (2001), Serviceability evaluation of floor vibration induced by walking loads, The Structural Engineer, Vol.79, No.21, pp.30-36.
16.6 Pachi, A and Ji, T., (2005), Frequency and velocity of walking people, The Structural Engineer, Vol. 83, No.3, pp.36-40.
16.7 BSI, (1996), BS 6399: Part 1: Loading for Buildings, London, ISBN 0 580 26239 1.
16.8 Littler, J. D., (1998), Full-scale testing of large cantilever grandstands to determine their dynamic response, Proceedings of the First International Conference on Stadia 2000, pp.123-134.
16.9 Ginty, D., Derwent, J. M. and Ji, T., (2001), The frequency ranges of dance-type loads, Journal of Structural Engineer, Vol.79, No.6, pp.27-31.
16.10 Ellis, B. R. and Ji, T., (1996), Dynamic testing and numerical modelling of the Cardington steel framed building from construction to completion, The Structural Engineer, Vol.74, No.11, pp.186-192.